A very eventful week for the global markets and based on STI reaction it seemed to be go back to square one. As such this has reopened up all the possible scenarios going forward. Before listing those highly possible scenarios based on how STI has progressed since the bottom in 2016, one thing to be confirmed is STI is in Primary degree Wave 3.
1. Intermediate Wave 3 Ongoing
This is the scenario mentioned in STI Analysis -- the next peak and trough ? (VIII), STI is doing a 3rd wave extension of 3rd wave in the Intermediate Wave 3 as shown in the chart below.

2. Intermediate Wave 2 Ongoing
The peak of 3611 in January 2018 was the peak of Intermediate Wave 1 and current correction which is yet to finish is Intermediate Wave 2. This is shown in the chart below. This was the scenario first mentioned in STI Analysis -- the next peak and trough ? (IV).

From another perspective takes a look at the STI weekly chart as shown

Of course there are still other possible scenarios on top of the above 2 but that will depend on how much STI has dropped going forward.
4 more days to end of 1Q, the quarterly window dressing and about 2 to 3 more weeks to commence another quarter of earning season. Will STI do a final drop at the end of the month to end this current correction or will the correction extends into next month to see a bottom around the earning season ?
Added 26th March 2018
The following chart tracks the current correction.

Instead of using the convention A-B-C to track the corrective waves, am using the W-X-Y method. W-X-Y is mostly for complex correction. Different between A-B-C and W-X-Y is A-B-C does a 5-3-5 structure while W-X-Y does a 3-3-3 structure. Using the W-X-Y count it seems to track the day-to-day STI movement very nicely. So far ((W)) and ((X)) have formed and now STI should be in the ((Y)) wave, the last of the correction. The ((Y)) wave should see a sub-level of (W)-(X)-(Y) happening. That is to say STI should be having a rebound soon the form the (W) and (X) before another and final drop to form the (Y) to complete the ((Y)). A level to watch for the end point should be the green-colored channel line. Let see whether is it so ?
Added 28th March 2018
Firstly, need to correct a incorrect count in the "Added 26th March 2018" section. As a-b already appeared in the ((Y)) wave so any rebound in STI should be c of the a-b-c to complete the (Y) and finally ((Y)). That is potentially the end point of the correction. Unless a rare "triple-three" scenario occurs then STI can see a rebound and then another drop to form the (Y)-(X)-(Z) to complete the ((Y)).
Secondly, after STI rebounded on 27th March 2018, the chart now look like

So potentially, the drop on Monday 26th March 2018 could be the end point for this correction. To confirm, STI will need to breakout of the green-colored upper channel. If that is the case, the overall structure of this correction is a triangle pattern. However, if there is another leg down going forward, that should be the last as the ((Y)) wave could be doing an impulse structure of 1-2-3-4-5. Did a quick check on US indices (DJ, S&P500 and Nasdaq) and all seem to point to a potential end of correction on the drop last Friday, 23rd March 2018.
Added 29th March 2018
So last day of 1Q where funds will be doing window dressing. The drop in yesterday presented an interesting view. See the chart below

Added 29th March 2018
So last day of 1Q where funds will be doing window dressing. The drop in yesterday presented an interesting view. See the chart below
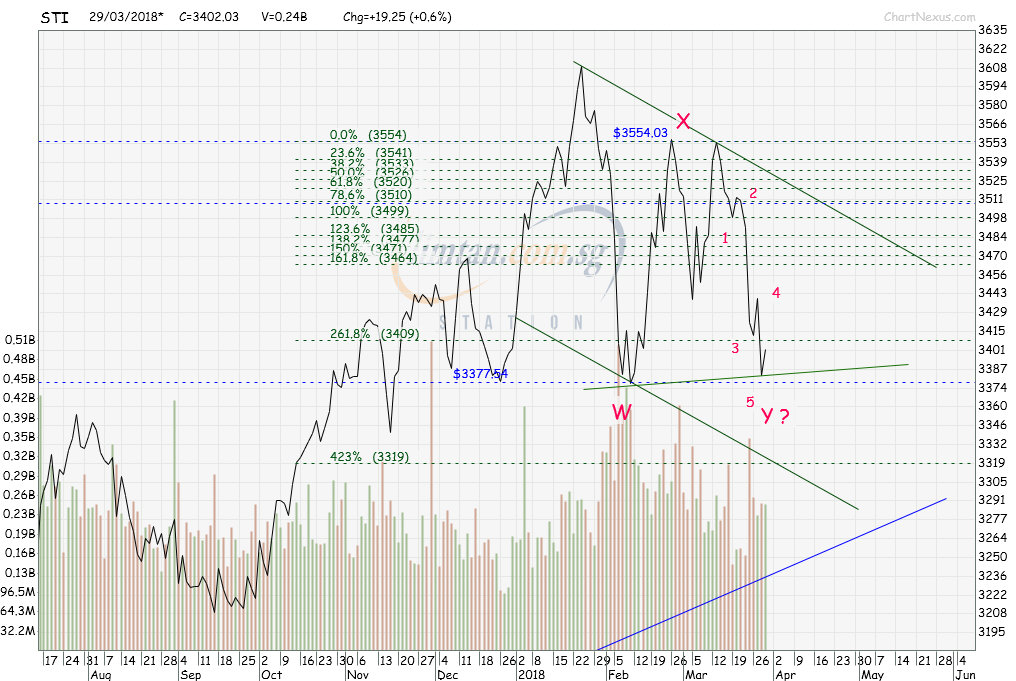
The above chart is what happening now on 29th March 2018 as I write this. The drop in yesterday follows by the rebound today as of now the wave Y does a wave 1-2-3-4-5, a complete Elliott Wave motive structure and if going forward if STI do not drop below yesterday low, STI could be reach the end of the present correction already. Another interesting point that was discovered was the length of the wave 1-2-3-4-5. Wave 3 is about 1.618x of wave 1 (the famous Fibonacci Ratio) and wave 5 is about the same length as wave 1. That fits nicely into a classic Elliott Wave motive pattern. 3 points to note going forward.
1. STI does not drop below 28th March 2018 of 3383, high potential correction has ended based on wave count.
2. A breakout of the upper channel will eventually confirm STI correction is over
3. Should the low of 3383 is broken again in which STI needs another re-count, the potential ending target is the lower channel trendline which is about 3320 level, also the 423.6% in term of Fibonacci Ratio.