Showing posts with label Elliott Wave. Show all posts

Friday, December 26, 2025

Can AI Perform Elliott Wave Analysis on STI ?

After developed the AI Trading System app, was curious can AI perform Elliott Wave analysis on historical chart to provide a pretty accurate wave count.  So, got a historical chart of STI starting from 1987 till present from Yahoo Finance.  Upload that chart image onto those AI chatbot (Copilot, Deepseek, ChatGPT, etc) and see what can they make of it, can they provide the Elliott Wave count.


The above is the STI historical chart from Yahoo Finance.  Technically, Singapore stock market started in 1966 but unfortunately, Yahoo Finance only have data from 1987 as the earliest.  Any serious implication for the missing data from 1966 to 1987 ?  Well, that difficult to affirm since we don't know during those periods, how STI behaved that could affect the wave count.  Thus, we could only do with starting point from 1987.


STI historical chart from 1987 till now. doing a top down approach, looking from SuperCycle degree of Elliott Wave, can make out the wave count of the above, obeying the rules and violations of Elliott Wave and also adhere as much as possible to the guidelines. provide also detail of the sub level Cycle and Primary degree wave count so they are inline with the SuperCycle degree count


The above is what being asked by me to each of the AI chatbot (Copilot, ChatGPT and Deepseek).  While all three are enable to give an Elliott Wave count in the SuperCycle degree from the above chart, all three responses are different from each other.  The initial response from these AI chatbot unfortunately raised doubts on the validity of the wave count.  Refer here for the detail exchange between me and ChatGPT regarding the wave count.  Was able to rebut successfully whatever the AI has suggested until I suggest my wave count to it to see whether that is valid.  Read the detail exchange and you can see that.


The above is what the wave count that I've suggested to the AI chatbot and you can read through the exchange log to see how the AI response to this wave count.  All I can say is I totally defeated AI for the Elliott Wave count for the STI.


The below is the detail description of my suggested wave count though the above labeling should be clear enough to understand.


Cycle 1 (1987 to 1993)

Normally, wave 1 is considered as impulse wave that display a sub 5-wave structure.  However, for the case of a diagonal (leading or ending), it displays a 3-wave pattern instead.  This is being labeled primary A-B-C in Cycle 1 above


Cycle 2 (1993 - 1998)

The wave 2 correction coincides with the 1997-1998 Asian Financial Crisis.  For those who have lived through those periods including me would surely recalled several important events.  From early 1990 to mid 1995, Singapore was having a stock market fever, you can easily heard auntie and uncle on the street boast about how easy to profit from stock market.  The stock market fever hit the highest in 1993 when SingTel was listed and making almost everybody can have a share of the stock.  From then on, stock market was like a bubble waiting to get burst and eventually led to the Barings Bank Collapse in 1995 and finally the 97/98 Asian Financial Crisis.  These series of events just sit well to describe the peak in 1993 and the subsequent deep correction of wave 2 till 1998.


Cycle 3 (1998 - 2007)

The recovery from 97/98 AFC was not a smooth sailing one as it soon hit another peak in 1999 and fell into Dot Com bubble burst.  The correction fell even further in 2002/2003 due to SARS pandemic and eventually recover to a fierce rally to the peak in 2007.  This fit the Cycle 3 stage with the peak in 1999 and trough in 2003 being the primary A-B-C of Cycle 3.  Another characteristic of a diagonal wave.


Cycle 4 (2007 - 2009)

What've happened from 2007 to 2009 think most would have known and no need me to get into detail.  The sharp correction again form a 3-wave pattern fit Cycle 4.


Cycle 5 (2009 - present)

This is the tricky part since the recovery of 2008 GFC in 2009.  Instead of a clear and well defined uptrend, STI went into a sideway trend till 2018.  Most people who attempt fitting Elliott Wave count would consider the 2009 as the start of a new impulse wave after the 2008 GFC.  Think it is common since the 2008 GFC is quite a major one.  However, the sideway pattern practically throw that assumption out of the window.  The sideway and complex structure can be explained as a 3-3-5 structure which form the 3-wave of the Cycle 5.  The Primary degree of the 3-3-5 structure (A-B-C) can further look into Intermediate degree as a Triple Three - Zigzag - 5-wave pattern as shown in the above diagram.  This is all agreed upon by AI too.


So going forward into 2026, STI could have a limited upside to complete Intermediate wave 3 which follows a correction for the Intermediate wave 4 before resuming to climb the final part of Intermediate wave 5 and conclude Cycle 5 of SuperCycle 1.  Alternatively, Intermediate wave 3 could have ended and STI is in the Intermediate wave 4 before resuming Intermediate wave 5.  Now, that is not the important part.  The most important, serious and deadly part is what happened after SuperCycle wave 1 ?  In Elliott Wave, SuperCycle wave 2 will follow and wave 2 in nature is a deep correction type, often retracting 61.8% - 78.2% of wave 1.  The starting value of STI in 1987 from the chart is about 800.  If assume, STI can hit 5000 to end SuperCycle 1, a 61.8% to 78.2% correction will see STI lands to between 1150 to 2400 for SuperCycle wave 2.  What's is even deadly is this is SuperCycle degree correction meaning timeframe will span multi decades.  While not expecting having the same timeframe as that of SuperCycle 1, half of that duration will be like 20 years !!!  

Note also, neither Copilot nor Deepseek initial response is what I've suggested SuperCycle wave 1 in a leading diagonal structure !!!

For those still don't quite understand how serious the SuperCycle correction is, take a look at Nikkei 225.  Nikkei 225 hit a peak of about 38,000 in 1989 and hitting the lowest point of the correction in 2009.  That is 20 years period.  Then it takes another 15 more years till 2024 to finally move above 38,000.  STI SuperCycle 2 correction could easily follow that trajectory !!!


While the above SuperCycle 1 wave count could still be invalidated depend on how STI will move to invalidate it as described by the AI chatbot, it would be wise to mentally prepare for a SuperCycle 2 correction.  Once get caught on the wrong end and you'll be done for multi decades.


Friday, February 15, 2019

Elliott Wave Calculator (2)

Continued from Elliott Wave Calculator -- FinTech ?

The 3rd function of the Elliott Wave Calculator -- Degree Calculator, after making some modifications, has appeared to be the most powerful Elliott Wave calculation tools compared to the Fibonacci Calculator and Correction Calculator.  The modification was done to the 2nd feature of the Degree Calculator, the All Degree calculation.  In the earlier version, the All Degree calculation feature of the Degree Calculator could only display the sub wave 1 of the next higher degree.  As such, to view the 5-wave structure of sub wave 3 and 5, the other feature of the Degree Calculator -- Main & Sub calculation has to be used.  In doing so, this has result in some tedious action despite the overall result still being the same.  After the modification, it is now able to choose to display either sub wave 1, 3 or 5 of the next higher degree just with a button click.  This has brought in more flexibility, ease of use and most important of all time saving in producing all the calculation.  The Main & Sub calculation still has its use as the All Degree part can only house until the Minor degree.  Anything below the Minor degree, Minute and Minuette degree will have to use the Main & Sub feature.

Now take a case study to demonstrate the capability of this Degree Calculator.


Above is the top level chart of Kep Corp from 1995 till present.  During these periods, Kep Corp has as shown from the chart completed a SuperCycle wave 3 in 1996, a SuperCycle wave 4 in 2001, a SuperCycle wave 5 in 2007, a SuperCycle wave C in 2008, a new SuperCycle wave 1 in 2011 and a new SuperCycle wave 2 in 2016.  Presently, it is in the new SuperCycle wave 3.  Due to its extensive data, the Degree Calculator can start from the SuperCycle level with the following inputs as these values were already happened.

1. SuperCycle C (SuperCycle 0) at $2.172
2. SuperCycle 1 at $9.038
3. SuperCycle 2 at $4.109


The above is what was been generated based on the 3 inputs.  As mentioned Kep Corp is now in SuperCycle 3 and from the sub-level of SuperCycle, 2 Cycle degree waves have already completed.  S3C1 at $8.582 in 2018 and S3C2 at $5.67 in 2018.  Putting these 2 new inputs into the Degree Calculator and re-calculate shall produce a different set of calculated data.


Can see that the generated data from Primary degree down are all different that the first iteration.  The interest part is the Minor degree as Kep Corp to be exact in degree level is in SuperCycle wave 3, Cycle wave 3, Primary wave 1, Intermediate wave 1 and Minor wave 3 (S3C3P1I1M3).  This is shown in the button click w3, w3, w1, w1 in the snapshot above. 


The above is the chart of Kep Corp since hitting the bottom at $5.67 last year till now after hitting a recent high of $6.38 followed by a low at $5.98 and then the present rebound.  If these 3 points are M0, M1 and M2 of the Minor degree of the Intermediate wave 1 of Primary wave 1 of Cycle wave 3 of SuperCycle wave 3 (S3C3P1I1), then the Degree Calculator has hit the nail on its calculation (look at the blue circle section of the snapshot).

M1 : $6.38 (Acutal) vs $6.389 (Calculated) -- difference +0.14%
M2 : $5.98 (Actual) vs $5.945 (Calculated) -- difference -0.59%

The difference between the actual and calculated value are within +/- 1%.  The whole thing just takes 2 iterations and went through 4 degree levels in between.  This is the type of precision the Algorithm of the Elliott Wave Calculator can produce.

Next, if the Main & Sub feature is being used to display the 5-wave structure of the Minor wave 3 (from $5.98 to projected $7.108), the Elliott Wave Calculator will be able to reveal even more interesting data.  The broken down level (Minute degree) actually display the ups and downs between $5.98 - $7.108.  Since it is Minute degree meaning the price movement of each of the Minute wave can be completed within days.  As such, to prevent anyone trying to take advantage and punt for quick profit from the calculated value, this will not be revealed here. 

What's being demonstrate from the case study above is from a top level Elliott Wave projection (using S0, S1, S2 to project S3, S4 and S5), the projected value is being used to count backward to determine convergence point.  Should a convergence point emerges, more likely the projected future value should be correct.  In another perspective, with the initial projected future value, backward count to the present count.  Putting in the actual value of the present count will refine the projected value to make it closer to the actual value (when happens in the future).

Kep Corp is one of those few stocks in Singapore stock market that follows Elliott Wave principle closely, as such, the precision of the calculated to actual value is very close, within +/- 1% type.  There are stocks that do not follow Elliott Wave principle as closely as Kep Corp in term of Fibonacci ratio, the precision of those calculated to actual value all come in within +/- 2.5%.  STI is one of them as blogged in STI Analysis -- Recap 2018 & Looking Ahead 2019.  Of course there are stocks that totally don't follow Elliott Wave principle and the Elliott Wave Calculator can tell when Elliott Wave rules violation occur.

This Elliott Wave Calculator despite having 3 functions now (Fibonacci Calculator, Correction Calculator and Degree Calculator) is not the final product of my development.  There are still other functions which I would like to include and there are also research being carried out on whether the Algorithm can be refined so that the number of iterations can be reduced to produce an even better precision.  Unfortunately, I am all alone on this development (from scratch) hence it probably take me some times to get all those things done.  What was being developed so far is approximately 1.5 months of work despite I'm not a software engineer by trade.


Saturday, February 2, 2019

Elliott Wave Calculator -- FinTech ?

Based on my knowledge on Elliott Wave, I've developed from scratch an Elliott Wave Calculator software to help analyze stock market movement.  Though this app is still developing, the very basic function is there and usable.  Question is how accurate can this be ?

Case Study 1
ComfortDelGro from Dec 2017 when it hit the low of $1.806 to the high of $2.49 in Oct 2018 and to the low again of $2.07 in Nov - Dec 2018.  During these periods, the price movement completed wave 1, 2, 3, 4, 5, A, B, C -- one cycle of Elliott Wave as shown from the chart below.


According to the above wave nodes and their respective value, this is input into the Elliott Wave Calculator (the Fibonacci Calculator) as shown in the snapshot below


The value of each of the wave and its respective Fibonacci ratio is being calculated and not the mention a chart is being plot just like the usual Elliott Wave.  Now, this is the how this Fibonacci Calculator works.  By just inputting Wave 0 and Wave 1 values, it can calculate the respective Wave 2, 3, 4, 5,  A, B and C values based on certain algorithm.  User can also just input Wave 0 and Wave 5 values and it is able to count backward to get the in between Wave 2, 3, 4 values.


The above snapshot is another feature of the Fibonacci Calculator, it is able to bring up a 2nd calculator and this is very handy when comes to comparing of values.  The left portion of the snapshot is the actual happened wave values.  The right portion as can be seen Wave 0 and Wave 1 values are the same as in the left portion -- inputting Wave 0 and Wave 1 to generate Wave 2, 3, 4, 5, A, B, C values.

Wave 2 : 1.873 (Actual) vs 1.882 (Calculated) -- difference +0.48%
Wave 3 : 2.464 (Actual) vs 2.406 (Calculated) -- difference -2.35%
Wave 4 : 2.220 (Actual) vs 2.206 (Calculated) -- difference -0.63%
Wave 5 : 2.490 (Actual) vs 2.453 (Calculated) -- difference -1.49%
Wave A : 2.110 (Actual) vs 2.187 (Calculated) -- difference +3.65%
Wave B : 2.370 (Actual) vs 2.320 (Calculated) -- difference -2.11%
Wave C : 2.070 (Actual) vs 2.053 (Calculated) -- difference -0.82%

Putting aside the corrective wave and just focus on the motive wave (wave 1 - 5), the difference between the actual and the calculated values are within +/- 2.5%.  For corrective wave, more will be discussed below.  This is done by just inputting Wave 0 and Wave 1 values.  Also note that, the "W3 Ext" feature has to be activated if not it is not possible to get the correct calculation.  Wave 3 (most of the time) or Wave 5 extension do occurred in Elliott Wave and this calculator is able to factor in those scenarios. 

Case Study 2
This time STI from the period Feb 2016 when it hit the bottom at 2528.44 to the peak of 3641.65 in May 2018 and finally the low of 2955.68 in Oct 2018.  This fits well an Elliott Wave cycle of Wave 1, 2, 3, 4, 5, A, B and C as shown in the chart below.


Next using those Elliott Wave points, this is being input into the Fibonacci Calculator as shown.


The value and its respective Fibonacci ratio are all displayed together with the Elliott Wave chart.  Next doing the same thing as in Case Study 1, bringing up the 2nd Fibonacci Calculator and input Wave values to generate rest of the values.


From the above snapshot, unlike in Case Study 1, Wave 0 to Wave 4 values have to be inputted in order to get a fairly accurate Wave 5, A, B and C values.

Wave 5 : 3641.65 (Actual) vs 3656.336 (Calculated) -- difference +0.40%
Wave A : 3196.150 (Actual) vs 3191.643 (Calculated) -- difference -0.14%
Wave B : 3347.98 (Actual) vs 3423.99 (Calculated) -- difference +2.27%
Wave C : 2955.68 (Actual) vs 2959.296 (Calculated) -- difference +0.12%

Comparing to Case Study 1, the difference between Actual and Calculated is even smaller.  This shows that the more input one put into the calculator, the more it is able to converge to the desired target.  The requirement to input so many values is not a fault of this calculator.  This is because of the basis and fundamental of Elliott Wave principle.  Each of the wave in Elliott Wave is related to the other by Fibonacci ratio, not an exact ratio but a range of ratio.  Example Wave 2 is not always going to be 61.8% of Wave 1 as the most likely occurrence is between 50% - 61.8%.  Wave 3 can be anything from 100% to 261.8% of Wave 1 too.  Should the price movement not able to track the very typical case of an Elliott Wave model, putting in more inputs is unavoidable.

Case Study 3
Kep Corp hit the low at $5.67 in Dec 2018, peaking at $6.38 in Jan 2019 and now in the correction phase.  To the exact, the Elliott Wave sequence that has completed is Wave 1, 2, 3, 4, 5, A and B.  Currently it is in Wave C.  The following is the Elliott Wave chart of Kep Corp


Inputting the completed Elliott Wave sequence into the Fibonacci Calculator will get the following snapshot


Have to blank out the calculated Wave C value as it is undergoing and it is a good idea not to reveal where Wave C will terminate at.  Now using the feature of by inputting Wave 0 & Wave 5 value into the Fibonacci Calculator to count backward of the Elliott Wave sequence, a feature that this Fibonacci Calculator is capable of doing in.


As seen from the snapshot above, Wave 0 ($5.67) and Wave 5 ($6.38) are inputted and Wave 2, 3, 4, A, B, C are calculated.  Again have to blank out Wave C value.  The followings are the differences obtained between the Actual and Calculator result

Wave 1 : 5.98 (Actual) vs 5.988 (Calculated) -- difference +0.13%
Wave 2 : 5.78 (Actual) vs 5.791 (Calculated) -- difference +0.19%
Wave 3 : 6.27 (Actual) vs 6.305 (Calculated) -- difference +0.56%
Wave 4 : 6.11 (Actual) vs 6.109 (Calculated) -- difference -0.02%
Wave A : 6.11 (Actual) vs 6.087 (Calculated) -- difference -0.38%
Wave B : 6.28 (Actual) vs 6.234 (Calculated) -- difference -0.73%

The differences are all within +/- 1%.

Next, revert back to count forward by inputting just Wave 0 ($5.67) and Wave 1 ($5.98) value.


The above is the snapshot for the default counting forward method.  Again, Wave C calculated value has to be blank off.  The differences between Actual and Calculated result are as followed :-

Wave 2 : 5.78 (Actual) vs 5.788 (Calculated) -- difference +0.14%
Wave 3 : 6.27 (Actual) vs 6.29 ( Calculated) -- difference +0.32%
Wave 4 : 6.11 (Actual) vs 6.098 (Calculated) -- difference -0.20%
Wave 5 : 6.38 (Actual) vs 6.363 (Calculated) -- difference -0.27%
Wave A : 6.11 (Actual) vs 6.078 (Calculated) -- difference -0.52%
Wave B : 6.28 (Actual) vs 6.22 (Calculated) -- difference -0.96%

Again the differences are all within +/- 1%.

Thus, regardless of counting forward or counting backward, the Fibonacci Calculator is able to generate fairly close result which is close to the actual one.

Correction Calculation
Elliott Wave corrective wave is not as simple as motive wave.  This is because, there are actually more than 20 correction pattern to form the A-B-C waves.  Each pattern has its own unique A-B-C Fibonacci ratio.  The A-B-C calculation in the Fibonacci Calculator uses the simple model of zigzag pattern.  I've also developed a Correction Calculator to compute all the possible Fibonacci ratio for the 20+ correction patterns.


The above snapshot is the Correction Calculator.  By entering Wave 5 and Wave A values, all the possible Wave B and Wave C values can be computed.  Above is the STI correction from 3641.65.  With Wave 5 and Wave A values being set as the actual values, the closest Wave B calculated value is 3366.331 (38.2% Fibonacci ratio) compared to the actual value of 3347.98, which is a difference of 0.55%.  It depends on what correction pattern it can form (zigzag, flat, triangle or combination) and that will determine the Fibonacci ratio of Wave C with respect to Wave A (or Wave AB).  Take the common case of Wave C = 100% of Wave A, this will give Wave C to be 2920.831 as shown in the above snapshot and that is -1.18% off the actual 2955.68.  The main purpose of this Correction Calculator is not to be spot on but rather provide all the possible targets to be expected during a correction.

There are other features in this Elliott Wave Calculator that is still developing and is unable to show it here at the moment.  So is this considered a FinTech ?  

Whether it is considered as FinTech or not, one important point is one must possess the knowledge of Elliott Wave in order to use it.  Simply punching in input to get the calculated values without analyzing from Elliott Wave perspective will get you nowhere.  Have been using to track ongoing price movement lately and found to be pretty spot on.  That I'm afraid can't illustrate here as this could easily lead to people profiting from the stock market.

As a result of this Elliott Wave Calculator, have decided to cut down the stock and indices analysis work on this blog.  Instead of using this Elliott Wave Calculator to foresee what could be coming and made the necessary preparation, this can turn into a punting for short-term profit tools, which is not my intention in developing it.

Friday, December 21, 2018

S&P 500 Elliott Wave Analysis (2)

Continued from S&P 500 Elliott Wave Analysis

The picture for S&P 500 looks clearer now with the ongoing hammering down. 


S&P 500 looks on course of doing a Expanded Flat correction for wave ((4)) as shown in the chart above.  Wave ((3)) has completed in January 2018 since the start in 2016.  For rest of the year and still ongoing, it is doing a wave ((4)) correction, a Cycle degree.  This is not surprising as time frame for Cycle degree ranges from 1 to several years.

Expanded Flat pattern is a 3-3-5 structure.  Wave (A) unfolded in a 3-wave down A-B-C ended in April 2018.  Wave (B) which according to Expanded Flat guideline is 123.6% of Wave (A).  Hence, S&P 500 exceeded the peak of wave ((3)) in October 2018.  Wave (B) also unfolded in a 3-wave A-B-C as shown in the chart.  Presently, it is the last wave of the Expanded Flat pattern, wave (C), which should be doing a 5-wave impulse or diagonal. Wave 1 and 2 of this 5-wave impulse/diagonal have completed and now it is in wave 3 with wave 4 and 5 yet to go.  Pattern wise, S&P 500 is doing the Expanded Flat but need to look at all the statistic to double confirm.

Wave ((3)) = 2872.87
Wave (A) = 2553.80
Wave (B) = 2939.86 (121.0% vs 123.6% Wave (A))

So far Wave (B) is meeting the guideline.  Now look at Wave (C).  Should Wave (C) doing a 5-wave impulse, it should behave very closely to Elliott wave basic model of w1 : w3 : w5 = 1 : 1.618 : 1 at least.

Wave 1 = 2603.54
Wave 2 = 2815.15 (62.92% vs 61.8% Wave 1)
Wave 3 = 2270.98 (calculated 161.8% Wave 1)
Wave 4 = 2478.86 (calculated 38.2% Wave 3)
Wave 5 = 2142.54 (calculated 100% Wave 1)

Now if present correction is Wave ((4)) and by Fibonacci retracement guideline, it should pull back to between 38.2% to 50%.  From the chart above, S&P 500% is already below the 38.2% and the Expanded Flat structure still yet to complete.  Therefore, the next destination shall be the 50% level at around 2340.  For an Expanded Flat, the guideline for Wave C is between 123.6% to 161.8% of Wave A.  This range calculates to be between 2462.69 to 2315.22.

If Wave (C) is a 5-wave impulse, the end point of Wave 5 is already beyond the 50% Fibonacci level for a wave 4 correction and also exceeds the guideline for the Expanded Flat structure.  Thus, there is a high possibility that Wave (C) going to be a diagonal instead of impulse.  Unfortunately, there isn't any Fibonacci guideline for a diagonal structure.  The only characteristic is wave 3 is not the shortest, wave 4 is expected to overlap wave 1 and wave 4 cannot move beyond start of wave 2.  Given now length of Wave 3 already exceeded length of Wave 1, this makes a possible rebound coming soon for wave 4.  With wave 4 expected to overlap wave 1, this will mean the rebound should bring S&P 500 above 2603.54 but not exceeding 2815.15.  Thereafter shall be the final drop of wave 5.  


Wednesday, November 21, 2018

S&P 500 Elliott Wave Analysis

US indices are renowned for following Elliott Wave very closely and it is worth to analyze to archive for future use.


Above is the S&P500 chart for the recent correction.  Ignoring the Elliott Wave degree it is in and just solely focus on the present correction, it is no doubt doing a zigzag pattern of A-B-C.  For each of A-B-C wave, there is another sub-level of a-b-c zigzag.  The following is some of the statistic observed from it.

W5 = 2939.86
A-a = 2710.51
A-b = 2816.94 (46.41% A-a)
A = 2603.54 (93.05% A-a)
B = 2815.15 (62.92% A)
C-a = 2670.75
C-b = 2746.75 (52.63% C-a)

The guidelines for a zigzag correction state that :-

1. Wave B typically retraces 38% - 79% of Wave A
-- Wave A-b, B and C-b all are the Wave B at different level and all retrace between 38% - 79% of Wave A

2. Wave C = 61.8%, 100%, 123.6% or 161.8% of Wave A
-- Wave A which is Wave A-c = 93.05% of Wave A-a, following the guideline

As Wave C still ongoing, it remains to be seen whether it will follow the guideline.

For C-c = 100% of C-a, this will lead S&P500 to 2602.35 level. 
For Wave C = 61.8% of Wave A, this will lead S&P500 to 2607.30 level

Looking at the above 2 end values, one deducing bottom-up and the other top-down, both converge to a value very close to each other.  This raise the possibility that S&P500 could end around that level for the current drop.  So, nothing to be alarmed should S&P500 getting another 1% to 2% drop in a single session since it has another 40 points to reach the level.

However, whether the present correction will it stop there is another question as this zigzag pattern could be a sub-level structure for a higher level pattern.

Sunday, November 18, 2018

DBS, OCBC, UOB Analysis (2)

Continued from DBS, OCBC, UOB Analysis

As mentioned in previous analysis all the 3 banks are in Primary degree Wave 4 of Cycle degree Wave 3 correction.  The question now is has the correction over for the 3 banks ?


The above are the charts for the 3 banks.  As clearly seen, OCBC is the only bank that has broken out of the downtrend channel.  DBS and UOB still have like 6.58% and 8.94% respectively away from breaking out of the downtrend channel.  The downtrend channel is very consistent for the 3 banks to provide a fair analysis and comparison.  Point A and B of the channel occurred at 30 Apr 2018 and 26 Sep 2018 respectively.  From Elliott Wave perspective, OCBC and UOB have done a Fibonacci retracement between 38.2% - 50% while DBS just above the 38.2% Fibonacci retracement level.  Looking at the price being corrected, UOB only corrected 20.05% from its peak in Apr 2018 to its recent low.  DBS did a 22.80% correction for the same duration  and OCBC corrected 23.82%.

According to definition of bear market, all 3 banks fell into bear market with their recent low (more than 20% correction).  However. till now, only DBS still yet to get out of the bear market as of closing price on 16th Nov 2018.  DBS, OCBC and UOB bear market price level are at $23.584, $10.88 and $23.856 respectively.  Remembered in previous analysis that DBS was the only bank among the 3 to be still in SuperCycle Wave 2 correction from 2000 to 2009.  So it is not surprisingly DBS still among the 3 banks to be still in bear market.  

That brings an interesting fact that some claimed DBS is the strongest bank in Singapore.  Well from the data back in the 2000s to the present, no matter how one look at it, is unconvincingly to be true.  

1. Should it be the strongest bank in Singapore, it will not be the only one fell into an extended SuperCycle Wave 2 correction back in 2000 - 2009.  

2. Should it be the strongest bank in Singapore, it will be the first to breakout from the downtrend channel and not OCBC for this correction.

3. Should it be the strongest bank in Singapore, it will not be the only one still in bear market as of now.

So better not build a mountain out of a mold to make such a strong statement !

Another point to raise based on the performance of the 3 banks, the linkage to STI performance.  The 3 banks pose a lot of weightage in STI despite other component stocks like SingTel, the Jardine group of stocks could move STI significantly.  Till now, STI still in the downtrend channel from STI -- the next peak and trough ? (33) analysis.  However, STI performance is not as bad as the 3 banks.  From the peak of 3641.65 to its recent low of 2955.68, STI only corrected 18.84%, not even enter the bear market by definition.  The recent rebound from STI could be said in a way helped by OCBC, the only bank stock to get out of the downtrend channel.  While STI might have other index component stocks to help it move out of the downtrend channel, one thing for sure is when the 3 banks all out of the downtrend channel, there is no reason for STI still stay inside.

Factually Incorrect

For the past days or weeks encountered 2 factually incorrect statements.

Political Party To Unite the People, the Nation
Factually, looking around the world from US, UK, France, Germany, Japan, Taiwan, Malaysia, Thailand, Indonesia, South Korea to Australia, etc politics (political parties) always divide the people, the nation.  There should not be any different in Singapore too.  In the first place if the people, the nation is not divided then there will not be politics (political parties).  Hence, do take a pinch of salt on this type of statement to prevent one being used as a prawn or tool for the propaganda of the political party.

Non-existence of Deep Root Culture
Factually, from a basic family unit to a company, an organization and government, there always exist a culture (norm) in doing things.  This is because of the act of the decision makers of all these entities.  Human Beings are not saint and are imperfect.  Whatever decisions they make will always have negative effects being tagged along.  It is these negative effects that after prolong periods (generations) of neglecting that it finally sinks to form deep root in the culture.  It is just a matter of times problems or issues associated with it surface and it is unavoidable.  Denying a deep root culture itself is a deep root culture already.  It is only bold to acknowledge this deep root culture that said entity could change or improve to become better.

Now what do the above 2 statement got to do with stocks or stock market ?  The first statement regarding politics has no direct relationship for sure.  The second statement on deep root culture in a certain perspective has impact.  Should the management of a company fail or choose to ignore the deep root culture, the management definitely is steering the company into the wrong direction and as an investor this is the type of company that one should avoid.

From an indirectly perspective, the ability to tell whether something is factually correct or incorrect will help one in making critical decision in investing in stocks (stock market).

Wednesday, November 7, 2018

ComfortDelGro Analysis (3)

Continued from ComfortDelGro Analysis (2)

Another index component stock that stick to Elliott Wave Fibonacci guideline very closely.


ComfortDelGro completed a 5-wave Primary degree Elliott Wave, Cycle degree Wave 1, at $2.49 since the start in Dec 2017.  Currently it is in Cycle degree Wave 2 correction.

Looking at the statistic for the 5-wave Primary degree Elliott Wave :-

P0 = $1.806
P1 = $2.083
P2 = $1.873
P3 = $2.464
P4 = $2.22
P5 = $2.49

This will give the following Fibonacci ratio :-

w1 : w3 : w5 = 1 : 2.134 : 0.975  
w2 = 75.81% w1
w4 = 41.29% w3

compared with the standard model (wave 3 extended) of :-

w1 : w3 : w5 = 1 : 2.618 : 1
w2 = 61.8% w1
w4 = 38.2% w3

Now come the current correction portion


Statistic for the correction so far :-

P5 = $2.49
PA = $2.11
IA = $2.31
IB = $2.19

So far the correction appears to be doing a zigzag pattern, a typical pattern for wave 2 (Cycle degree Wave 2 in this case).

PB-IB = 60% PB-IA
PB-IC = 100% PB-IA => $$2.39 (hit high of $2.37 today)

With P5 at $2.49, PA at $2.11, 

if PB = $2.39 => 73.68% PA
if PB = $2.37 => 68.42% PA

A typical Fibonacci guideline for a zigzag pattern is Wave B to retrace between 38% to 79% of Wave A.  A 79% would make PB to be between $2,41 - $2.42.  Hence, current level is very close to the end of PB.

If PB = $2.39 => PC = $2.01 (100% PA)
If PB = $2.37 => PC = $1.99 (100% PA)
If PB = $2.41 => PC = $2.03 (100% PA)
If PB = $2.42 => PC = $2.04 (100% PA)

Note also that the 61.8% and 78.6% Fibonacci Retracement level for Cycle degree Wave 2 are at $2.07 and $1.95 respectively.  The above calculation price level for PC falls well within the 61.8% - 78.6% Fibonacci level for a wave 2 correction.

To summarize :-

Should the current Wave 2 correction is a simple zigzag pattern,

Wave B (PB) for current correction should end between $2.37 - $2.42
Wave C (PC) for current correction should end between $1.95 - $2.07


Added 10th Nov 2018

3Q18 earning for ComfortDelGro was released yesterday.  Key points of the result :-

Revenue :-
3Q17 = $891.7M
3Q18 = $967.9M
2Q18 = $941.1M

Revenue increased 8.5% y-o-y and 2.85% q-o-q

Op Cost :-
3Q17 = $780.2M
3Q18 = $854.5M
2Q18 = $831.6M

Op Cost increased 9.5% y-o-y and 2.75% q-o-q

Op Profit :-
3Q17 = $111.5M
3Q18 = $113.4M
2Q18 = $109.5M

Op Profit increased 1.9% y-o-y and 3.56% q-o-q.  This is something that was expected, better than 3Q17 as being analyzed on 11th Aug 2018 after the 2Q18 result.

Net Profit :-
3Q17 = $80.1M
3Q18 = $78.5M
2Q18 = $75.0M

Net Profit fell 2% y-o-y but increased 4.67% q-o-q.  This has missed the expectation that its Net Profit could be equal to that of 3Q17 as analyzed on 11th Aug 2018.  The reason for lower Net Profit was lower dividend from its investment.  In 2Q18 it received +$0.5M or +22.7% from its investment but in 3Q18 it received -$0.6M or -15.8% from its investment.  Should it received the same absolute increment in dividend in 2Q18, its Net Profit would be $79.1M (-1.25% vs 3Q17).  Should it received the same percentage increment in dividend in 2Q18, its Net Profit would be $83.16M (+3.82% vs 3Q17).  Furthermore, its Net Profit is +4.67% q-o-q.

It is not a set of unexpected shocking negative result.  Though its Net Profit still yet to turn the corner, it is improving (2Q18 Net Profit was -5.5% of 2Q17).  This was highlighted in its presentation as followed


The worst part of its earning is over, the sharpest recovery part probably also over, now is the stabilization or the gradual recovery.  Its fundamental might not be the same as in the past due to the fact that private hired car is here to stay and its taxi operation is no longer the same as in the past.  However, its management has finally realized that and starting to diverse into other investment to offset the good old days of taxi operation.  The result showed that effort is working.  From the look of it, it just need 1 or at most 2 more quarters to finally turn the corner.  That is the fundamental of ComfortDelGro and how its being associated to the price movement ?  

Fundamental dictates the price movement which allows TA to project and not the other way round.  


The Elliott Wave count should not change much.  It is in the final PC leg of a zigzag pattern.  The only missing is an up down in IA and IB in the PC wave.  The set of 3Q18 earning is not a negative result which should lead to the formation of the IA and IB before resume the final down.  The final down to the above projected target is something not surprising should it happen as ComfortDelGro has yet to fully turn the corner in its earning.  It is gradually improving but not there yet.  Another 1 or 2 more quarters might do the work.  With that, its correction is at least 2/3 completed and probably going into 3/4 completion next week.  There isn't much downside to it comparing to the upside it will generate going forward.  Will it go down to the projected target as what Elliott Wave describes or some price level above that will have to depend on the fundamental.

Added 15th Nov 2018

The breakdown at $2.18 today confirmed the completion of IA and IB of PC and heading down toward the various targets of PC as mentioned above.


Just as expected after the 3Q18 earing the price moved up to form the IA and IB part of the PC wave.  The 61.8% and 78.2% Fibonacci retracement for a C2 correction are at $2.067 and $1.952 respectively.  If going by PA-PB-PC ratio with PC = PA, the end target shall be $1.99.  If focus on the PC wave along whereby IC = IA, the end target will be $2.05.  The expected target of $1.95 - $2.07 as mentioned above should not be difficult to meet given the breakdown at $2.18 today is of high volume,

Thursday, November 1, 2018

OCBC Analysis (2)

Continued from OCBC Analysis and DBS, OCBC, UOB Analysis

A new development happened to OCBC price performance today.


As shown from the chart above, OCBC hit an intra-day high of $11.21 and closed $11.15 today.  This level appears to be breakout from the downtrend channel with high volume.  Does that mean the Primary Wave 4, P4, correction for OCBC has ended at $10.36 on 30th Oct 2018 ?  Unfortunately, it is still uncertain until the price level moves to the a conclusive level.  However, do not rule out the possibility that it is too.

This is a P4 correction, a retracement of between 23.6% - 38.2% occurs 15% of the time while between 38.2% - 50% is 60% of the time.  Also P1 peaked at $9.50 and price should not fall below $9.50 as that will result in rule violation.  P3 peaked at $13.60 so a 38.2% retracement will be at $10.95 and is considered invalid as price went below that.  50% retracement is at $10.13 and so far the low is at $10.36.

Red Wave Count
The correction IA-IB-IC is doing a 5-3-5 zigzag pattern with IA and IB completed.  The wave count suggests $10.36 is the IC-M3.  Today rebound is the IC-M4.  Since today price level already overlaps IC-M1, it is doing a 5-wave diagonal.  For this wave count to be valid meaning $10.36 is not the end of the correction, IC-M4 cannot exceed IC-M2 at $10.57.  If this case is the valid wave count, it will have 1 last drop to complete IC.

Green Wave Count
This wave count uses 3-wave A-B-C method to label the wave count starting from Minute degree to Minute degree and finally to Intermediate degree.  This wave count presents both IA and IB same as the Red Wave Count.  The different is the IC part has completed at $10.36.  This suggests if this wave count is valid, correction has ended and now is the post-correction uptrend M1.  This bodes well with the fact of today breakout at the downtrend channel.  This wave count will be valid and invalidate the Red Wave Count if price moves further up above $11.57 going forward.

While there are 2 different wave counts giving different conclusion, the critical level at $11.57 is the same.  It is at this critical level that it will determine either the Red or the Green Wave Count is valid and also whether the correction has finally ended.

Some statistical analysis for this correction.

1. IB = 38.89% IA, a guideline that Wave B in general retraces 38% - 79% of Wave A

2. IC = 61.8% IA => $10.24.  If $10.36 is the end of correction, it will be less than 61.8% of IA, something that is outside the guideline

3. IC = 100% IA => $9.20.  Though this is the typical case, it is also an impossible case as at this level, P4 will overlap P1 result in rule violation.

Thus, there is no strong conclusion that correction has ended but there is also a possibility that it is so.  Just have to watch out for the critical level at $11.57.  Should this is the case, OCBC will be the FIRST of the 3 local bank to get out of correction, STRONGEST bank in Singapore !


Added 5th Nov 2018

Fell short of the $11.57 instead just managed a high of $11.54 on 2nd Nov 2018.  Now is looking at how much it will pull back and this will have different interpretation and also provide an early confirmation that has the correction over.

A pull back not below $10.80 is the key level now.  Should the correction has ended, this will be the post-correction sub-level wave 1.  The pull back will be sub-level wave 2 and $10.80 is the 61.8% Fibonacci Retracement level, a very typical value for wave 2 correction.  Any pull back below $10.80 raise the possibility of correction has not ended.  A break below the $10.36 low will definitely confirm still in correction.

Added 15th Nov 2018

Finally, the price fell to hit the 50% Fibonacci level at $10.96 when its hit an intra-day low of $10.94.


If this is the post-correction uptrend wave, the current pull back should be M2.  Whether M2 has finished today to still have some more downside to hit the 61.8% Fibonacci level at $10.82 is still too early to tell.  Couple of events noted :-

1. Price hit a high at $10.56, just 1 cents lower than the $10.57 resistance level, a theoretical level for peak of M1 if this is the post-correction uptrend

2. The upper limit of the downtrend channel which OCBC broke out on 1st Nov 2018 intersect nicely the 61.8% Fibonacci level at $10.82 making it a potential ending target for M2 correction.

3.  Should the price fell further and breakdown at the 78.6% Fibonacci level at $10.62, it raise the possibility that the correction actually has yet to ended and back to square one.

Added 20th Nov 2018

Price hit intra-day low at $10.79, hitting the 61.8% Fibonacci retracement level at $10.82 and closing at $10.81.


So is that considered the end of M2 correction ?  Technically and statistically is no as M2 can hit as low as the 78.6% Fibonacci retracement level at $10.62 or somewhere between $10.82 - $10.62.  However, the $10.62 level will be a key level now.  Should that break, the previous analysis that OCBC has ended the correction at $10.36 could become invalid meaning it is still in correction.  If that case happens, will have to relook at the wave count.

Sunday, October 28, 2018

STI, Bear Market & Elliott Wave

STI fell to an intra-day low of 2955.68, that is like a drop of 18.84% from the high of 3641.65, less than 2% from entering a bear market.  As for why a drop of 20% is a de facto definition for bear market, that is questionable as far as concern but shall not be discussed here.  However, in Elliott Wave, there is only uptrend, downtrend, motive and corrective, no concept of bull or bear market.  Nevertheless since bull & bear market is like a standard term in stock market, let see whether there is any relationship between a bear market and Elliott Wave.

Bear market always happens in Elliott Wave SuperCycle corrective wave as recession always accompanies with it.  As for Cycle degree and below it is uncertain.  One certain fact is as the degree gets lower, the occurrence of bear market will be became zero.  As such, this leads to a worthy effort in investigating the relationship between bear market and Elliott Wave especially in Cycle and Primary degree.

Take the case of STI from 2007 to 2009, the 2008 GFC when STI hit the peak of 3906.16 in Oct 2007 and the trough or end of a SuperCycle degree correction at 1455.47 in Mar 2009.


A drop of 20% from 3906.16 would be 3124.92.  The above chart shows the Elliott corrective wave -- ((A)), ((B)), ((C)), from 2007 to 2009.  Bear market was entered in Jan 2008 and hit the trough in Mar 2009, a period of 15 months.  It occurred when it was still in Wave ((A)).  The rebound Wave ((B)) brought it back up from bear market but Wave ((C)) forced it back again.  The duration of the whole corrective wave was 18 months.  That means 83.33% of the time it was in bear market or it took 16.67% of time before entering a bear market.

Next look at STI from 2015 to 2016.  It reached a peak of 3549.85 in Apr 2015 and hit the trough at 2528.44 in Feb 2016.  This correction is an Elliott Wave Cycle degree.


A drop of 20% from 3549.85 would be 2839.88.  The above chart shows the Elliott corrective wave -- (A), (B), (C) from 2015 to 2016.  Bear market was entered in Aug 2015 and hit the trough in Feb 2016, a period of 6 months.  It occurred when it was still in Wave (A).  The rebound Wave (B) brought it back up but to re-enter again in Wave (C).  The duration of the whole corrective wave was 10 months.  That means 60% of the time it was in bear market or it took 40% in time before entering a bear market.

Now look at the ongoing correction which hit peak at 3641.65 in May 2018.  This correction is an Elliott Wave Primary degree.


A drop of 20% from 3641.65 would be 2913.32.  The above chart shows the Elliott correct wave -- A, B, C from May 2018 till now.  Bear market is yet to enter and will it enter is still unknown.  However, looking at present situation, it is most likely to enter.  The correction is already 5 months old, it is already in Wave C and yet to enter bear market.

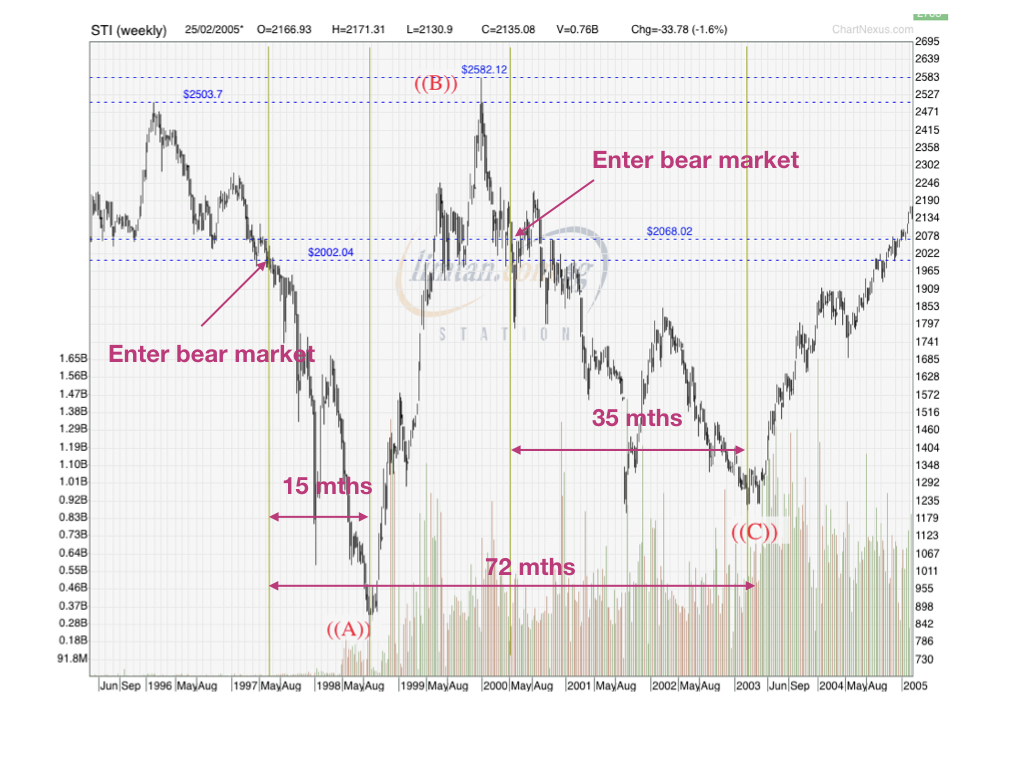
Back track STI to prior 2007 to see whether can find more statistic and from the data available (1994 - present), the only one was the 1996 to 2003 Elliott Wave SuperCycle degree correction.


The peak was at 2504 in Feb 1996 and hit the trough at 1205.31 in Mar 2003.  This was a super lengthy SuperCycle degree correction as there was AFC in 1997-1998, dot.com bubble in 2000, Singapore recession from 2001 - 2002 and SARS crisis in 2003.  This was a multi-events triggered Elliott Wave correction within a period of 6 years.  The whole correction lasted 86 months (Feb 96 to Mar 03) with the bear market entered in Apr 2007 when it fell 20% from 2504 to 2003.2.  It entered while still in Wave ((A)) with Wave ((B)) brought it back up from bear market only to re-entered in Wave ((C)).  The duration of the bear market till trough was 72 months.  That means 85.71% of the time it was in bear market or it took 14.29% in time before entering bear market.  

From the above statistic, the followings can be deduced :-

1. The Elliott Wave correction duration decreases as the degree decreases from SuperCycle to Cycle to Primary.

2. Bear market occupies at least 80% of the duration of a SuperCycle degree correction.

3. Bear market occupies at least 50% of the duration of a Cycle degree correction (deep correction to be specific) if it happens.

4. Bear market highly to occur in Primary degree correction (deep correction to be specific) but not enough statistic to deduce the duration of the bear market.

5. Bear market enters during Wave A of a SuperCycle and Cycle degree correction, move out of it during the Wave B but to re-enter in the Wave C.  However, for Primary degree, none happens.  Look like Wave A is the place to decide on occurrence of bear market. 

6. For the case of Primary degree correction, bear market could be only to be entered during Wave C if there is one and this probably the reason for the case that there might not be a bear market in Primary degree correction compared to a sure thing in SuperCycle degree correction.

7. Bear market duration decreases as Elliott Wave degree gets lower.

8. Duration of correction could shrink by 45% or a factor of 0.55 times as Elliott Wave degree gets lower (from 2007 to 2016 data as 1996 - 2003 was a complex correction).

9. Time to enter bear market could increase 2.4 times as Elliott Wave degree gets lower (from 2007 to 2016 data as 1996 - 2003 was a complex correction).

10. Duration of bear market could decrease by 60% or a factor of 0.4 times as Elliott Wave degree gets lower (from 2007 to 2016 data as 1996 - 2003 was a complex correction).   This might contradict point 9 resulting bear market might or might not happen scenario.

While there is lacking of strong concrete evidences to conclude the relationship between bear market and Elliott Wave due to the shortage of data in the investigation, it does provide some form of rough guide of what to expect in an Elliott Wave correction.  Should more data are available, the investigation should be able to provide more reliable result.  

The duration of bear market gets shorter as the degree of Elliott Wave gets lower.  This could provide a rough guide of when to expect the trough of the correction.  This should be the relationship between bear market and Elliott Wave that is proved to be important.

The following is the rough guide of what to expect for the ongoing Primary degree correction based on the findings as above, an ongoing study perhaps.

1. Cycle degree correction is 0.55 times that of SuperCycle degree correction (from 2007 to 2016 data).  Using the same factor, the present Primary degree correction if is 0.55 times that of Cycle degree then this will last 5.5 months.  Since present correction is already 5 months old, it is therefore could be ending soon.

2. Cycle degree takes 2.4 times longer to enter bear market than SuperCycle degree (from 2007 to 2016 data).  Using the same factor, the present Primary degree will take almost 96% in time to enter one.  That probably explains why the present Primary degree correction still yet to enter one.

3. Cycle degree bear market duration is 0.4 times that of SuperCycle degree (from 2007 to 2016 data).  Using the same factor and with the guide that the duration of the correction is 5.5 months, STI should be in bear market already.  This contradict point 2 as mentioned in the above findings.  Hence, this is the case that a Primary degree correction might or might not enter bear market.  However, should it enter one, it should be a brief period only.

As a whole, bear market should not be a making a mountain out of a mold type of view (so popular among analysts and TA practitioners ) or something to fear in or panic in.  Instead, it should serve as a guide of when thing going to end, a one step ahead view of the stock market.

Lastly, relationship between bear market and Elliott Wave should only apply to indices and not stocks as stocks have their company and industry fundamental to be considered during any Elliott Wave correction.

Sunday, October 21, 2018

DBS, OCBC, UOB Analysis

The following is a Supercycle to Primary degree Elliott Wave analysis of the 3 local banks -- DBS, OCBC and UOB.  It is not meant to analyze the detail present correction but rather as a guide of how their impact on STI in general.  Due to the weightage of the 3 local banks on STI, their price performance play a key role in determine the direction or trend of STI.  The process of deciding the Supercycle wave count shall not be covered and the stated will be the valid or highly possible one.

DBS

The following is the chart of DBS from 1995 till now.


The 1998 AFC caused its to ended up in Supercycle Wave ((C)) following a recovery to a new Supercycle Wave ((1)) in 2000.  However, for whatever reason, it went into Supercycle Wave ((2)) correction all the way till 2009, across 2001-2003 recession and 2008 GFC, probably due to fundamental issue of DBS.  Supercycle Wave ((2)) ended in 2009 and since then it is on Supercycle Wave ((3)).  This Supercycle Wave ((3)) is on a wave 3 extension run with Cycle degree Wave (1) and (2) completed in 2011.  From 2011 till now it is doing the Cycle Wave (3) extension with Primary Wave 1, 2 and 3 completed.  Present is the Primary Wave 4 correction, which probably terminates between 23.6% - 38.2% or 38.2% Fibonacci level.  Thereafter shall be Primary Wave 5 to complete Cycle Wave (3).  Another correction in Cycle Wave (4) will follow before the final up wave, Cycle Wave (5) to complete the Supercycle Wave ((3)).  Thereafter should be another financial crisis and recession that results in Supercycle Wave ((4)).

OCBC

The following is the chart of OCBC from 1995 till now.


The 1998 AFC ended with Supercycle Wave ((C)).  Unlike DBS, it managed to complete a new Supercycle Wave ((1)) in 2007 with Cycle degree correction during the 2001 - 2003 recession.  The 2008 GFC ended with Supercycle Wave ((2)) in 2009.  Since then, it is on Supercycle Wave ((3)).  Like DBS, the Supercycle Wave ((3)) is on a wave 3 extension run with Cycle degree Wave (1) and (2) completed in 2011.  From 2011 till now it is doing a Cycle Wave (3) extension with Primary Wave 1, 2 and 3 completed and now in Primary Wave 4 correction.  This correction probably almost done as it is between 38.2% - 50% Fibonacci level already.  The correction for OCBC is rather faster and deeper than DBS at this moment.  Upon completion of this correction it will be on Primary Wave 5 to complete Cycle Wave (3).  Thereafter shall be Cycle Wave (4) correction before the final up wave, Cycle Wave (5) to complete the Supercycle Wave ((3)).  Supercycle Wave ((4)) should occur in the next financial crisis and recession.  

The above Supercycle degree wave count is different from OCBC Analysis, this should be the more accurate one.  Despite the different, the correction analysis in that post remains valid.

UOB

The following is the chart of UOB from 1995 till now.


Like both DBS and OCBC, the 1998 AFC ended with Supercycle Wave ((C)).  Unlike DBS but like OCBC, it recovered and peaked in 2007 for the new Supercycle Wave ((1)).  The 2008 GFC caused its to fall into Supercycle Wave ((2)) which ended in 2009.  Since then, like the other 2 banks, it is on Supercycle Wave ((3)) doing a wave 3 extension.  Cycle Wave (1) and (2) completed in 2011 and now is the Cycle Wave (3) extension with Primary Wave 1, 2 and 3 completed.  Present correction is Primary Wave 4.  It should probably terminate between 23.6% - 38.2% or 38.2% Fibonacci level.  Upon completion of the correction it will resume the uptrend to finish Primary Wave 5 and complete Cycle Wave (3).  Next, shall be Cycle Wave (4) correction.  Thereafter will be the final up wave Cycle Wave (5) to complete Supercycle Wave ((3)).  The next financial crisis and recession will trigger it to fall into Supercycle Wave ((4)).

Summary

To summarize, the 3 local banks are on a similar trajectory after 2009, all pointing to further upside before the next financial crisis and recession.  The possible destination of Supercycle Wave ((3)) using statistical calculation, which really surprising as be it from top-down to bottom-up calculation all values converge, will not be revealed in this post to prevent misuse of information for personal gain.

If the 3 local banks are on a Supercycle Wave ((3)) uptrend, there is no reason STI is not following the same.  Have came across an Elliott Wave analysis on STI lately citing STI could still be in the corrective wave since the peak in 2007, a decade of correction for no obvious reason ?  On first look it is possible but after getting into detail wave count (in actual fact there are lot of flaws in that analysis saying STI still in corrective wave since 2009) coupling with the Elliott Wave count of the 3 local banks it is very difficult to convince STI is lagging so much behind and still in corrective wave.