Doing a rerun of the previous analysis as found to have committed several mistakes along the way. The most prominent mistake was overlooking the Elliott Wave guideline, in particular the Fibonacci level, confusing the different Elliott Wave degree when counting forward. Though guidelines are not rules and they may or may not be true, should start questioning when guidelines are not met. By doing so, will prevent jumping in too early to conclude the wave count.
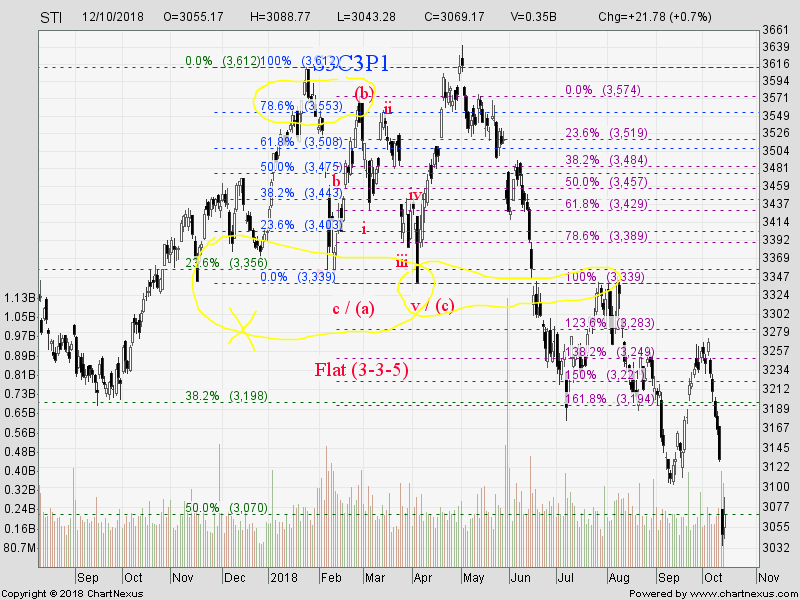
From January to April 2018, STI has developed a Flat (3-3-5) pattern as shown in the chart above. Wave (b) of the Flat is 86% of wave (a), almost the 90% guideline. Wave (c) ended exactly at the same level as wave (a) hence it is 100% of wave (ab), on the spot as guideline. At sub-level, a 3-3-5 pattern also formed thus confirming the Flat pattern. However, this pattern is just slightly more than 23.6% Fibonacci Retracement of S3C3P1, Primary Wave 1. It is a very shallow correction for a wave 2. This raise the doubt that correction is not done and this level is a sub-level for the correction. As it is a Primary Wave 2, the ABC or WXY seen shall be Intermediate degree. For this Flat pattern, it is a degree lower than Intermediate, Minor degree.
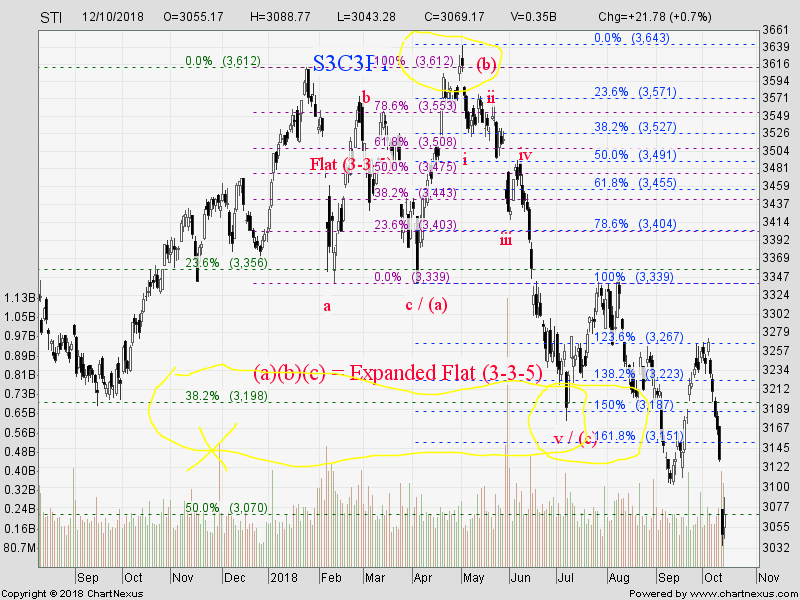
From April to July 2018, STI has developed into an Expanded Flat (3-3-5) pattern as shown in the chart above. The Flat pattern from January to April as from Intermediate degree perspective is just a 3-wave a-b-c pattern. Thus, this form the first 3 of the Expanded Flat pattern. Wave (b) retraced more than wave (a), a typical feature for Expanding Flat. The guideline is for a 123.6% of wave (a) but just fall short of that. Next, the 5-wave pattern for wave (c) of the Expanded Flat is clearly defined. Guideline states that wave c is 123.6% to 161.8% of wave ab and here wave (c) ended in the 150% to 161.8% region. At this stage could have qualified that the correction has ended as this Expanded Flat is an Intermediate degree pattern. However, at that level, it is only between 38.2% to 50% Fibonacci Retracement of Primary Wave 1, still not in the common range of 50% to 61.8%. Therefore, this raise the doubt that the correction still have not ended. If the correction is not ended then this should evolve into a double-three combination of WXY.

Should the Expanded Flat is the final correction pattern, the rebound will have to breakout at 3339 level, the base of Minor wave a, c and Intermediate wave (a). That did not happen concluding the correction was not over. The rebound thus formed the Wave (x) of the double-three. The first part of the double-three, Wave (w) is the Expanded Flat pattern. Guideline states that wave x is 50%, 61.8%, 76.4% or 85.4% of wave w. Here, wave (x) only retreated slightly more than 38.2% of wave (w) as shown from the chart above, falling short of the guideline. Now, here is the interesting and tricky part, wave (y). A clear zigzag pattern a-b-c was defined. Furthermore, it is between 100% to 123.6% of wave (w) in which the guideline is wave y = 61.8%, 100% or 123.6% of wave w. That looks very promising for the correction to be concluded as ended with a double-three combination of Expanded Flat - Zigzag. This was the part when in previous analysis said correction is over by Elliott wave count. One thing that was overlooked at that moment was the Fibonacci Retracement level, it is still between 38.2% to 50% of wave 1, not in the common range of 50% to 61.8%. Should that point taken in, doubt should be raised that correction might still have not finished and not jumping into conclusion too easily. It turned out to be true as the rebound fell short and unable to breakout from the key level at 3339. However, due to the Elliott Wave system, warning that the correction was not done was flagged when the pull back exceeded 78.6% Fibonacci level (refer STI Analysis -- the next peak and trough ? (28)), the day before STI plunged to break 3102.73

A double-three combination pattern can only ends either a zigzag, flat or triangle pattern. Hence, going forward, wave (y) could be one of the 3. Guidelines of a double-three combination state that :-
1. wave x = 50%, 61.8%, 76.4% or 85.4% of wave w
2. wave y = 61.8%, 100% or 123.6% of wave w
3. wave y can not pass 161.8% of wave w
Points 1 and 2 have been discussed as above. Point 3 is the key now. From the way STI has moved, can rule out the case of wave (y) being a flat as flat develops into a 3-3-5 pattern. It is impossible to complete a 5-wave now as firstly wave i too long and it looks very likely to pass beyond 161.8% of wave w. Therefore, zigzag and triangle seem likely with bias towards zigzag while keeping the triangle option opens. For a zigzag pattern, guideline states that
1. wave b = 50%, 61.8%, 76.4% or 85.4% of wave a
2. wave c = 61.8%, 100%, 123.6% or 161.8% of wave a
3. wave c = 161.8% of wave b
The above chart shows the zigzag case. Wave (b) is slightly more than 68.2% of wave (a). Fibonacci ratio guidelines for wave (c) are :-
If wave (c) = 100% wave (a) ==> 3034
If wave (c) = 123.6% wave (a) ==> 2978
If wave (c) = 161.8% wave (a) ==> 2887
All these values are between the 50% to 78.6% Fibonacci Retracement level for Primary Wave 2.
For the overall correction (w)(x)(y) pattern, Fibonacci ratio guidelines for wave (y) are :-
If wave (y) = 61.8% wave (w) ==> 3079
If wave (y) = 100% wave (w) ==> 2913
If wave (y) = 123.6% wave (w) ==> 2810
Since wave (c) cannot exceed 161.8% of wave (a) meaning the case of wave (y) = 123.6% of wave (w) will be conflict of guideline. With STI already below 3079, the case for wave (y) = 61.8% wave (w) is also impossible. Eliminating all the conflicts and impossibles, the possible range for wave (y) to end should be between 2887 to 3034 and this range is less than 78.6% Fibonacci Retracement level for Primary Wave 2.
No matter what the case or where the correction will end, STI 3340 is the key level that must be overcome to confirm, be it the Elliott Wave analysis or any other form of technical analysis, that the correction is finally over !
There was a rebound on 12th Oct 2018 but that rebound is only about 23.6% Fibonacci retracement, way below the guideline of at least 50% for a zigzag pattern. However, should that be considered valid, with the following guidelines :-
1. wave C = 61.8% wave A ==> 2941.88
2. wave C = 100% wave A ==> 2851.09
The 2851.09 is already outside the range as stated above, thus leaving the 2941.88 level as the only one possible. Ironically, 2942 is the 61.8% Fibonacci retracement for Primary Wave 2. It does look like STI still have some more downside to go as the 2 statistic analysis all converge to 1 level.
Going forward, if there is any rebound, it could either be the wave B that was missing so far or the real post-correction uptrend. The only way to tell the difference is the Fibonacci ratio. Wave B according to guideline at most retraces 85.4% of wave A (for a zigzag case) and if the rebound does more than that or even surpass the 3272.88 level, that should be the post-correction uptrend already.
Should today is the bottom of the correction, will not be surprise either as STI is inside the range for correction to end.
If wave (c) = 100% wave (a) ==> 3034
If wave (c) = 123.6% wave (a) ==> 2978
If wave (c) = 161.8% wave (a) ==> 2887
All these values are between the 50% to 78.6% Fibonacci Retracement level for Primary Wave 2.
For the overall correction (w)(x)(y) pattern, Fibonacci ratio guidelines for wave (y) are :-
If wave (y) = 61.8% wave (w) ==> 3079
If wave (y) = 100% wave (w) ==> 2913
If wave (y) = 123.6% wave (w) ==> 2810
Since wave (c) cannot exceed 161.8% of wave (a) meaning the case of wave (y) = 123.6% of wave (w) will be conflict of guideline. With STI already below 3079, the case for wave (y) = 61.8% wave (w) is also impossible. Eliminating all the conflicts and impossibles, the possible range for wave (y) to end should be between 2887 to 3034 and this range is less than 78.6% Fibonacci Retracement level for Primary Wave 2.
No matter what the case or where the correction will end, STI 3340 is the key level that must be overcome to confirm, be it the Elliott Wave analysis or any other form of technical analysis, that the correction is finally over !
Added 16th Oct 2018
STI hit an intra-day low 3030.21 and closed 3034.31. This has caused STI to fall into the possible range of ending point 2887 to 3034 mentioned above. It fact it closed on the dot at the upper limit of the range. Still unsure whether today has really hit the end of the correction. Technically, should see a rebound from the drop of 3272.88 to form the B wave of the zigzag.There was a rebound on 12th Oct 2018 but that rebound is only about 23.6% Fibonacci retracement, way below the guideline of at least 50% for a zigzag pattern. However, should that be considered valid, with the following guidelines :-
1. wave C = 61.8% wave A ==> 2941.88
2. wave C = 100% wave A ==> 2851.09
The 2851.09 is already outside the range as stated above, thus leaving the 2941.88 level as the only one possible. Ironically, 2942 is the 61.8% Fibonacci retracement for Primary Wave 2. It does look like STI still have some more downside to go as the 2 statistic analysis all converge to 1 level.
Going forward, if there is any rebound, it could either be the wave B that was missing so far or the real post-correction uptrend. The only way to tell the difference is the Fibonacci ratio. Wave B according to guideline at most retraces 85.4% of wave A (for a zigzag case) and if the rebound does more than that or even surpass the 3272.88 level, that should be the post-correction uptrend already.
Should today is the bottom of the correction, will not be surprise either as STI is inside the range for correction to end.