STI plummeted today to an intra-day low of 3270.22 from 3392.29 and closed 3290.62 for the day. That was a drop of 101.67 points or 2.99% in a single day. Surprising ? Unexpected ? Well not really if one follows Elliott wave analysis as the drop is something expected all along.
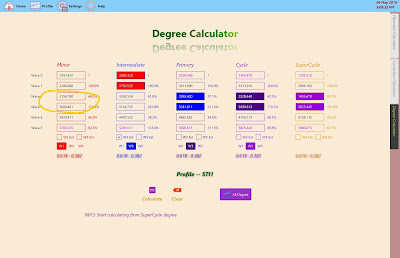
Recap previous Elliott wave calculation done by the Degree Calculator as shown below
STI is now in the Minor wave 3 which started from 3156.79 and a projected calculated target of 3668.461 to end the Minor wave 3. STI will not move up one straight line from 3156.79 till 3668.461 as within this length, a sub-level of Elliott wave can be formed (wave 1 - 5).
Above snapshot is the sub-level Elliott wave generated by the Degree Calculator for the Minor degree wave 1 - 5 in the earlier snapshot. As can be seen the 5-wave generated between 3156.79 to 3668.461 (sub wave 3) circled in red. That was the initial generation giving a wave 1 peak at 3385.623 while STI hit a high of 3415.18 on 29th Apr 2019 before the plummet. The initial generated data was 0.87% off the actual value, well within the +/- 2.5% range. The wave 2 of the initial generated data is 3244.204 (if the peak is 3385.623) and today intra-day low is 3270.22, that is again about 0.8% off the today low. So, the fall today wasn't something unexpected. This is Elliott wave, it is able to calculate the turn of each wave value if the wave count is correct but unable to tell what events cause the turn.
Perhaps Trump is a mega fan of Elliott wave too as S&P 500 according to Elliott wave analysis is ripe for a correction after hitting 2950.
So is today the low of the wave 2 ? That is not important, what's important is STI must follow the pattern of the Elliott wave calculation as above to maintain the correct wave count at the higher degree.
In another word, in Elliott wave analysis, whether STI rockets or plummets is all defined in the wave count already. So nothing to be shocked of and those events are something expected to come.

