Continued from STI Analysis -- the next peak and trough ? (70)
STI-N
STI-N
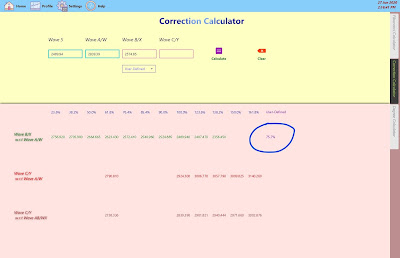
STI did see a zigzag since the drop from 9th Jun 2020 but the question now is where and when will the Minor wave (b) of Intermediate wave ((c)) ends. The intra-day low of 2574.85 on 25th Jun 2020. The rebound on 26th Jun 2020 could suggest 2574.85 is the end of Minor wave (b).
Above is generated from the Correction Calculator. STI 2574.85 is 75.7% Fibonacci retracement of wave A. This figure fits the guideline that wave B typically retraces 38 to 79 percent of wave A. Thus, the possibility is there. One comforting sight was the selling down since 9th Jun 2020 lacks volume. Apart from a volume spike on 19th Jun 2020, the general trend was declining in volume as STI fell. The spike in volume on 19th Jun 2020 was due to that day being quadruple witching. Those in the stock market for long enough should know what happen on this day. Every year there will be 4 days on this nature. Thus, nothing surprising to see surge in volume, surge in price or even sudden drop in price. Should STI continue to fall further going forward even breaking below 2489.94, Intermediate wave ((b)), then in need of recount and the drop since 9th Jun 2020 could be Primary wave 5.
There are some concerns present drop is it really into Primary wave 5. On the surface it does look possible but on a detail analysis basis, there raise several questionable to qualify that.
Above chart shows the case of Primary wave 4 has ended on 9th Jun 2020. As mentioned it raises several questions in this wave count. Firstly, Intermediate wave ((a)) lasted on 4 days when the time frame for Intermediate degree is from weeks to months. Secondly, the box out region is the so-called Intermediate wave ((b)) for this region. However, there seem to unable to fit in an ANY 3 correction pattern (A-B-C or W-X-Y) to it. If that can't hold, Intermediate wave (((b)) is invalid. Perhaps my limited knowledge in Elliott Wave analysis fail to fit in an ANY 3 correction pattern ? Lastly, the volume in general has been in declining trend for a so-called Primary wave 5. Typically declining volume alongside declining price usually suggest a bottom could be in sight next. The so-called bottom to be labeled as Primary wave 5 appears to be very short, doesn't make any logical sense either.
As mentioned before, Primary wave 4 is rather "meaningless". What most waiting for is Primary wave 5, the one that will break below March low (Primary wave 3). So even if now is the start of Primary wave 5, it is still "meaningless".
Singapore Covid-19
打油诗
主将无能垮三军
左士缺策只砸钱
右士辱人自被辱
左象无计只会泣
右象理人理出祸
左马略识色不分
右马讲据终慢拍
小卒仗权乱闹事
大敌当前夸本领
火烧眉头方才悟
城门紧闭称闭窗
高傲自大多借口
知错不认真懦夫
主将无能垮三军
左士缺策只砸钱
右士辱人自被辱
左象无计只会泣
右象理人理出祸
左马略识色不分
右马讲据终慢拍
小卒仗权乱闹事
大敌当前夸本领
火烧眉头方才悟
城门紧闭称闭窗
高傲自大多借口
知错不认真懦夫


