Continued from V Shape Recovery ?
In the previous write up a question was raise shouldn't using the index more appropriate to illustrate the point. So here, am using the STI to illustrate the point whether we are seeing a V Shape Recovery.
In V Shape from Elliott Wave perspective this is refers to either wave 1, 3 or 5 as the preceding wave is always a drop. Before starting, one must know EW only has 3 rules and if any violation, the wave count will be invalid. The 3 rules are :-
1. Wave 2 never retraces more than 100% of wave 1
2. Wave 3 cannot be shortest among the 3 impulse waves, namely wave 1, 3 and 5.
3. Wave 4 cannot overlap wave 1 except in diagonal formation
Case 1 -- STI is Wave ((1))

The above is for this present so-called V shape being SuperCycle wave ((1)). As such, the peak in 2018 shall be SuperCycle wave ((5)) and the ((A))-((B))-((C)) with 2208.42, the low in March 2020 which many claimed is the bottom, the wave ((C)). With 2018 peak being wave ((5)), the trough in 2009 will be wave ((4)) and in between the various zigzag is the Cycle degree wave (1) to wave (5) doing an ending diagonal pattern. A relatively common to happen in wave 5. Why diagonal ? Wave (4) overlaps wave (1) but didn't retrace below wave (2) and that satisfies all the condition of a diagonal formation. The 2007 peak without any doubt will be SuperCycle wave ((3)) and the trough in 2003 will be SuperCycle wave ((2)). SuperCycle wave ((1)) will be the peak before the 1997-98 AFC.
This wave count has an EW rule violation that is SuperCycle wave ((4)) overlaps SuperCycle wave ((1)). Another questionable point is the correction from 2018 till March 2020 is too shallow for a end of cycle (1-2-3-4-5) correction. Thus, this case is INVALID meaning the so-called V Shape cannot be so.
Case 2 -- STI is Wave ((5))

The above is for this present so-called V shape being SuperCycle wave ((5)). As such, the trough in March 2020 shall be SuperCycle wave ((4)) and the peak in 2018 is SuperCycle wave ((3)). 2009 trough shall be SuperCycle wave ((2)) and 2007 peak is SuperCycle wave ((1)). The peak before 1997-98 AFC will be previous SuperCycle wave ((5)) and the correction thereafter ended in 2003.
This wave count has an EW rule violation that is SuperCycle wave ((3)) is shorter than SupeCycle wave ((1)) making it shortest among the 3 impulse waves. There are also other questionable points that is the existence of a diagonal 5-wave in the sub-level of SuperCycle wave ((3)). Diagonal wave usually exists in wave 1, wave 5, wave A and wave C. Another is SuperCycle wave ((3)) never exceed SuperCycle wave ((1)). Though this is not a rule but has never happened before. Thus, this case is INVALID meaning the so-called V Shape cannot be so.
Case 3 -- STI is Wave ((3))

The above is for this present so-called V shape being SuperCycle wave ((3)). As such, the trough in March 2020 shall be SuperCycle wave ((2)). The peak in 2018 is SuperCycle wave ((1)) which started from 2009. The in between 5-wave diagonal is so-called the leading diagonal for wave 1. 2007 peak shall be previous SuperCycle wave ((5)), 2003 trough is previous SuperCycle wave ((4)) and the peak before 1997-98 AFC is previous SuperCycle wave ((3)). Looking through, there isn't any EW rules violation and no questionable parts too. So it is clean and make this case valid meaning yes the V shape recovery can be claimed.
However, EW is not just as simple as that, each impulse wave is made up of another 5-wave in the sub-level. SuperCycle wave ((3)) is made out of Cycle degree wave (1), (2), (3), (4), (5). Cycle wave (1) is further made out of Primary degree wave (1), (2), (3), (4), (5) and so on. For the wave to be fully valid, all levels shall not have any rules violation.

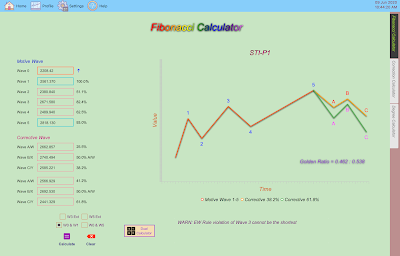
The above is how STI performs since the low in March 2020. If this is the so-called SuperCycle wave ((3)), the sub-levels (Cycle, Primary, Intermediate, Minor, etc) must display the EW pattern (1-2-3-4-5-A-B-C) without any rules violation. The labeling so far shows Intermediate ((i)), ((ii)), ((iii)), ((iv)) and now ongoing ((v)). In this wave count, one questionable is the overlapping of wave ((iv)) with wave ((i)). This is valid if it is a diagonal wave. However, at the point of writing, STI hits an intra-day high of 2818.13 and putting those statistic into the Fibonacci Calculator to determine is there any rules violation

Above is what being calculated by the Fibonacci Calculator. Clearly, there is a warning message saying EW rule violation of wave 3 cannot be the shortest. Thus, the current uptrend since March 2020 cannot be qualified as an impulse wave. If this cannot be valid, the claim of this is SuperCycle wave ((3)) cannot hold and the so-called V shape cannot be claimed too.
There is a slim chance this still valid that is an extended wave 3 case. This is assumption only, until we have confirmation it is better not to trust it fully.
There is a slim chance this still valid that is an extended wave 3 case. This is assumption only, until we have confirmation it is better not to trust it fully.
As very much like most wanted to believe the bottom already happened in March 2020 and the sharp rise thereafter is so-called the V shape recovery, there isn't any EW count so far can claim so. Most possible cases ended with EW rules violation.
V shape recovery is possible but not for the current sharp rebound since March 2020 !
Added
Technically speaking, the wave count from 2009 till 2018 which is being labeled as diagonal 5-wave is already displayed EW rule violation of wave 3 cannot be the shortest. That was why in the STI Analysis -- the next peak and trough ? series, the peak in 2018 is part of the SuperCycle wave ((2)) correction which started in 2015.
Technically speaking, the wave count from 2009 till 2018 which is being labeled as diagonal 5-wave is already displayed EW rule violation of wave 3 cannot be the shortest. That was why in the STI Analysis -- the next peak and trough ? series, the peak in 2018 is part of the SuperCycle wave ((2)) correction which started in 2015.
Singapore Covid-19
打油诗
主将无能垮三军
左士缺策只砸钱
右士辱人自被辱
左象无计只会泣
右象理人理出祸
左马略识色不分
右马讲据终慢拍
小卒仗权乱闹事
大敌当前夸本领
火烧眉头方才悟
城门紧闭称闭窗
高傲自大多借口
知错不认真懦夫
主将无能垮三军
左士缺策只砸钱
右士辱人自被辱
左象无计只会泣
右象理人理出祸
左马略识色不分
右马讲据终慢拍
小卒仗权乱闹事
大敌当前夸本领
火烧眉头方才悟
城门紧闭称闭窗
高傲自大多借口
知错不认真懦夫