Continued from Ichimoku AI Trading System -- Part I and Ichimoku AI Trading System -- Part II
Finally, completed a working version of the Ichimoku AI System !!!
Before proceed, let do some clarification, in the previous 2 edition, version 1 and version of the app, that should not be considered anything as AI. Those should be classified as automation instead. So, this version 3, IS REALLY AI !!!
What's the difference ? In automation, we just make use of computation power to fasten the process and in the case of Ichimoku signal detection, it just simply marks out the buy and sell signals based on the rules that we input, the very typical Ichimoku buy and sell signals. It WILL NOT PREDICT the nature of the signals. In AI, the story is different. historical data were fed to the AI model for machine learning, to train it to recognize the pattern as to when and how the buy and sell signals should be generated. Features, in particular Ichimoku's features (characteristics) were injected along with target (buy and sell conditions) for it to train on the historical data. Once the model is trained, the real data will feed in for it to predict the buy and sell signals based on what it has learned so far. The output is probability of buy and sell (and do nothing) signals and based on the probability, we could classify them into Strong Buy, Weak Buy, Strong Sell and Weak Sell signals to further aids our decision of entry and exit. AI is not supposed to take over the control to make decision for us but assist us only. This is the correct way to use AI !!!
Now, let see some example what this AI system can do. We'll looking at STI in the period 1st Jan 2007 to 20th Oct 2007. This is the period STI on a bull run and finally peak on 12th Oct 2007 then crash all the way down till Mar 2009 due to the US subprime crisis. We all knew what happened (where the peak and trough is) since it is already an happened event. However, the data being fed into the AI system is as if it is looking at on 20th Oct 2007. What the AI model did was being trained on historical data prior to 1st Jan 2007 and do the prediction for 1st Jan 2007 till 20th Oct 2007 based on what it has learnt.

We can see the AI model is able to predict a weak sell signal around the 12th Oct 2007 peak. Also note the gray shaded region. This is the region whereby there is no Chikou span signal for the AI model to use on its prediction. This is mainly Chikou span is a laggard signal, shift backward 26 period. So the question is did the AI model's decision making being affected given Chikou span is one of the component that indicate bullish (Chikou span above price) or bearish (Chikou span below price).

The above is the same period as the first figure, the only different is the Risk Level was adjusted (look at the red circle in the top left region). This is a feature that I put in to the AI system. Stock market volatility is always changing and it will play a part in the decision on whether one should enter or exit the stock market. As shown from the above screenshot, there are more weak sell signals leading up the the peak and quite a prominent strong buy signal at the trough before the peak. These made the AI model prediction looks right on the track.

The above screenshot moved the ending period to 20th Nov 2007 so that the peak on 12th Oct 2007 has moved out of the no Chikou span zone. This is the see whether now with Chikou span signal being available for the AI mode, will the final decision anything different. Again, the weak sell signal near the peak remain, so as the strong buy signal at the trough prior to the peak. Probably, this is just a special case whereby the prediction the AI model made is independent of Chikou span.

We now move to 9 Mar 2009 when STI hit rock bottom and recover from the crisis. Again, we are trying to see the AI model can predict any buy signal at or near this bottom. The testing period is from 1st Jan 2008 to 15th Mar 2009. 9th Mar 2009 is now inside the no Chikou span zone. As we knew whole of 2008 STI was down, down, down all the way and the AI model didn't fail to predict that as all the strong sell signals were flashing along the way. Now, the AI model didn't manage to predict any buy signal around 9th Mar 2009 maybe due to lack of Chikou span signal.
We now move the period till 31st Mar 2009 so that 9th Mar 2009 is near to come out of the no Chikou span zone. Walah !!! a strong buy signal pop out.
Above is the period extends till 20th Apr 2009 so that 9th Mar 2009 is totally out of the no Chikou span zone. This time even better 2 strong buy signals pop out. While still couldn't be very conclusive did the Chikou span play some parts in the AI model prediction, the assure is the AI model is pretty well able to predict correctly near the trough.
To be able to making good prediction is not good enough if you don't make use of it. Next, we will be carrying out a little simulation to emulate trading based on the AI predicted buy and sell signals. This is the part that I've integrated into the app apart from just pure looking at metrics and backtesting results.

This time we'll looking at 1st Jan 2019 till 31st Dec 2020, the period stock market hit by the unexpected Covid-19 pandemic. Well, maybe we can predict when financial crisis can happen next but definitely not a natural disaster like pandemic. This is real test for the capability of the AI prediction. Looking at the above AI prediction, while the AI didn't predict a buy signal (weak or strong) at the trough, it did manage to predict 2 strong buy signal near the next trough. Strong sell signals also appear near most of the peak and especially the one just before STI crash to the trough. This means should anyone follow the AI prediction, should be able to avoid the crash to the bottom.

This is the simulation to simulate buy strategy (only on strong buy signal to enter and strong sell signal to exit) using the above AI prediction. Can see only 3 trades were performed and all turn out to be winning trade and a realized profit of 15.51% were achieved, annualized to 7.50% return for this period. This is definitely outperformed than you simply buy on 1st Jan 2019 and hold till 31st Dec 2020 when you only suffered negative return.
The same simulation but this time we changed the buy and sell signal from only strong to both (either strong or weak and we'll enter and exit). The return is even better with 19.19% profit and annualized return of 9.20% but the win rate dip to 75% only meaning 2 out of 8 trades were cut loss.
Normally, investors don't short the market when it was on a downtrend but traders are different. The next simulation as above is to simulate how a trader will react to the AI predicted signals, long and short. Here, we only focus on the strong signal to long or short. 6 trades were done with 3 long and 3 short and all came out winning. This net a profit of 54.52% or annualized gain of 24.38%. So this AI system is able to cater for trader as well.
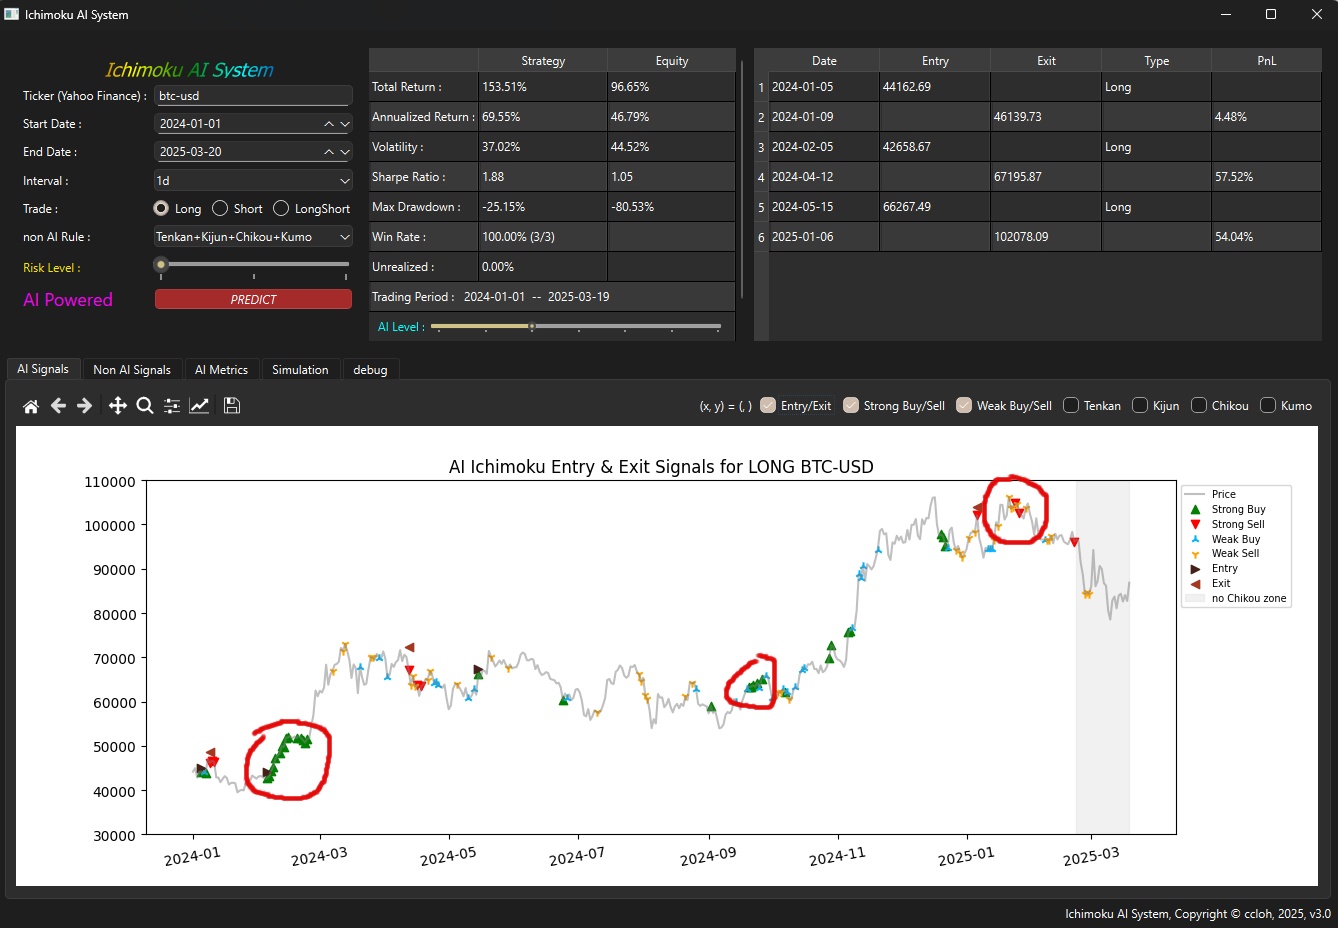
Now, we turn to a more volatile entity, BTC and see how the AI's prediction can benefit our investment or trading. Above is the AI prediction for BTC from 1st Jan 2024 till 20th Mar 2025 (yes, today !!!!). Look at the 3 red circles, a very prominent entry and exit point. For those interested, look at the region near today, no buy signal was predicted so far.
The above is the long only simulation with strong signals for these periods. Only 3 trades were done and all came out winning. That gives a realized profit of 124.65%, annualized to 94.81% return.
While this is not the final working version as there are definitely bugs that yet to discover, features need enhancement and fine tuning especially to be more precise how the AI model going to make prediction at the no Chikou span zone, this working version nevertheless is quite impressive to certain aspect.
Perhaps, somewhere at other parts of the earth already have such an AI system, this is definitely something fully developed by me (ccloh) in 2025, fully AI Ichimoku system.
This I will dedicate (or put it bluntly a pot shot) to SMU for being snobbish to snub me from attending the Ichimoku TA class with my SkillsFuture credit. Not to mention to Singapore Government of the day -- PAP, another those high nose stance that everything also talk about foreign talent. Hey, this AI system is fully developed by a local born citizen that serve that bloody 2.5 yrs of NS and went through hell from that pressure cooking education system who is not specialize in programming and only know about AI when I started developing on this. Whatever certifications that this pseudo elite government that always pride themselves from wearing white cited as requirement, all I don't have and yet based on my solo effort I develop this AI system !!!