Bear market always happens in Elliott Wave SuperCycle corrective wave as recession always accompanies with it. As for Cycle degree and below it is uncertain. One certain fact is as the degree gets lower, the occurrence of bear market will be became zero. As such, this leads to a worthy effort in investigating the relationship between bear market and Elliott Wave especially in Cycle and Primary degree.
Take the case of STI from 2007 to 2009, the 2008 GFC when STI hit the peak of 3906.16 in Oct 2007 and the trough or end of a SuperCycle degree correction at 1455.47 in Mar 2009.

A drop of 20% from 3906.16 would be 3124.92. The above chart shows the Elliott corrective wave -- ((A)), ((B)), ((C)), from 2007 to 2009. Bear market was entered in Jan 2008 and hit the trough in Mar 2009, a period of 15 months. It occurred when it was still in Wave ((A)). The rebound Wave ((B)) brought it back up from bear market but Wave ((C)) forced it back again. The duration of the whole corrective wave was 18 months. That means 83.33% of the time it was in bear market or it took 16.67% of time before entering a bear market.
Next look at STI from 2015 to 2016. It reached a peak of 3549.85 in Apr 2015 and hit the trough at 2528.44 in Feb 2016. This correction is an Elliott Wave Cycle degree.

A drop of 20% from 3549.85 would be 2839.88. The above chart shows the Elliott corrective wave -- (A), (B), (C) from 2015 to 2016. Bear market was entered in Aug 2015 and hit the trough in Feb 2016, a period of 6 months. It occurred when it was still in Wave (A). The rebound Wave (B) brought it back up but to re-enter again in Wave (C). The duration of the whole corrective wave was 10 months. That means 60% of the time it was in bear market or it took 40% in time before entering a bear market.
Now look at the ongoing correction which hit peak at 3641.65 in May 2018. This correction is an Elliott Wave Primary degree.

A drop of 20% from 3641.65 would be 2913.32. The above chart shows the Elliott correct wave -- A, B, C from May 2018 till now. Bear market is yet to enter and will it enter is still unknown. However, looking at present situation, it is most likely to enter. The correction is already 5 months old, it is already in Wave C and yet to enter bear market.
Back track STI to prior 2007 to see whether can find more statistic and from the data available (1994 - present), the only one was the 1996 to 2003 Elliott Wave SuperCycle degree correction.
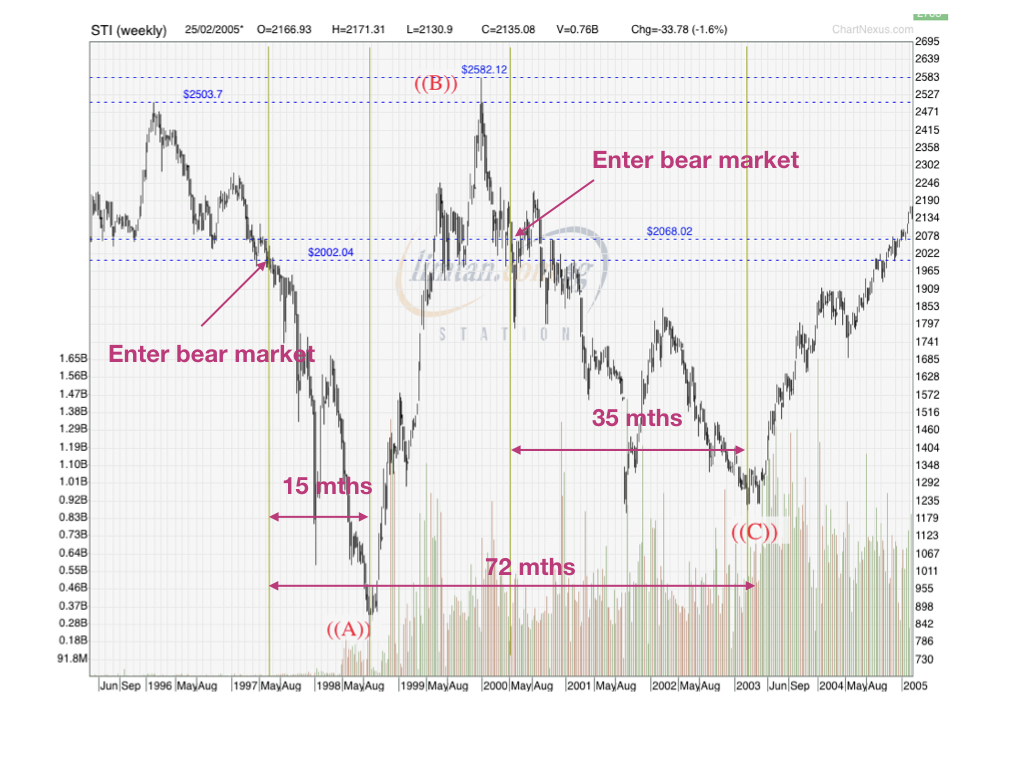
The peak was at 2504 in Feb 1996 and hit the trough at 1205.31 in Mar 2003. This was a super lengthy SuperCycle degree correction as there was AFC in 1997-1998, dot.com bubble in 2000, Singapore recession from 2001 - 2002 and SARS crisis in 2003. This was a multi-events triggered Elliott Wave correction within a period of 6 years. The whole correction lasted 86 months (Feb 96 to Mar 03) with the bear market entered in Apr 2007 when it fell 20% from 2504 to 2003.2. It entered while still in Wave ((A)) with Wave ((B)) brought it back up from bear market only to re-entered in Wave ((C)). The duration of the bear market till trough was 72 months. That means 85.71% of the time it was in bear market or it took 14.29% in time before entering bear market.
From the above statistic, the followings can be deduced :-
1. The Elliott Wave correction duration decreases as the degree decreases from SuperCycle to Cycle to Primary.
2. Bear market occupies at least 80% of the duration of a SuperCycle degree correction.
3. Bear market occupies at least 50% of the duration of a Cycle degree correction (deep correction to be specific) if it happens.
4. Bear market highly to occur in Primary degree correction (deep correction to be specific) but not enough statistic to deduce the duration of the bear market.
5. Bear market enters during Wave A of a SuperCycle and Cycle degree correction, move out of it during the Wave B but to re-enter in the Wave C. However, for Primary degree, none happens. Look like Wave A is the place to decide on occurrence of bear market.
6. For the case of Primary degree correction, bear market could be only to be entered during Wave C if there is one and this probably the reason for the case that there might not be a bear market in Primary degree correction compared to a sure thing in SuperCycle degree correction.
7. Bear market duration decreases as Elliott Wave degree gets lower.
8. Duration of correction could shrink by 45% or a factor of 0.55 times as Elliott Wave degree gets lower (from 2007 to 2016 data as 1996 - 2003 was a complex correction).
9. Time to enter bear market could increase 2.4 times as Elliott Wave degree gets lower (from 2007 to 2016 data as 1996 - 2003 was a complex correction).
10. Duration of bear market could decrease by 60% or a factor of 0.4 times as Elliott Wave degree gets lower (from 2007 to 2016 data as 1996 - 2003 was a complex correction). This might contradict point 9 resulting bear market might or might not happen scenario.
While there is lacking of strong concrete evidences to conclude the relationship between bear market and Elliott Wave due to the shortage of data in the investigation, it does provide some form of rough guide of what to expect in an Elliott Wave correction. Should more data are available, the investigation should be able to provide more reliable result.
The duration of bear market gets shorter as the degree of Elliott Wave gets lower. This could provide a rough guide of when to expect the trough of the correction. This should be the relationship between bear market and Elliott Wave that is proved to be important.
The following is the rough guide of what to expect for the ongoing Primary degree correction based on the findings as above, an ongoing study perhaps.
1. Cycle degree correction is 0.55 times that of SuperCycle degree correction (from 2007 to 2016 data). Using the same factor, the present Primary degree correction if is 0.55 times that of Cycle degree then this will last 5.5 months. Since present correction is already 5 months old, it is therefore could be ending soon.
2. Cycle degree takes 2.4 times longer to enter bear market than SuperCycle degree (from 2007 to 2016 data). Using the same factor, the present Primary degree will take almost 96% in time to enter one. That probably explains why the present Primary degree correction still yet to enter one.
3. Cycle degree bear market duration is 0.4 times that of SuperCycle degree (from 2007 to 2016 data). Using the same factor and with the guide that the duration of the correction is 5.5 months, STI should be in bear market already. This contradict point 2 as mentioned in the above findings. Hence, this is the case that a Primary degree correction might or might not enter bear market. However, should it enter one, it should be a brief period only.
As a whole, bear market should not be a making a mountain out of a mold type of view (so popular among analysts and TA practitioners ) or something to fear in or panic in. Instead, it should serve as a guide of when thing going to end, a one step ahead view of the stock market.
Lastly, relationship between bear market and Elliott Wave should only apply to indices and not stocks as stocks have their company and industry fundamental to be considered during any Elliott Wave correction.