
To ensure the Supercycle wave count is more accurate, the following criteria are being adopted.
1. Any economic recession shall occur in Supercycle degree corrective wave
2. Any severe weakness in company or industry fundamental shall occur in Supercycle degree corrective wave
3. Any weakness in company or industry fundamental can occur in Cycle degree corrective wave
The followings are the possible wave count.
Wave Count 1 (Black)
Supercycle Wave ((1)) in 2007 and Wave ((2)) in 2009 due to 2008 GFC. It completed Wave ((3)) in Mar 2018 and now in Wave ((4)). Though during these periods there isn't any economic recession, the ongoing US-China trade war and the concern of oversupply from its client on smart lighting which are having impact on company and industry fundamental. Correction still ongoing as uncertainty on when those issues could be fully resolved.
Wave Count 2 (Red)
Supercycle Wave ((3)) in 2007 and Wave ((4)) in 2009 due to 2008 GFC. It completed Wave ((5)) in Mar 2018 and now in the corrective ((A))-((B))-((C)) with Wave ((A)) completed only. Ongoing is Wave ((B)) and the reason is listed in Wave Count 1 (Black). However, there is a serious doubt in this wave count, the value at Wave ((4)) is almost 0. Thus, this wave count could be invalid.
Wave Count 3 (Green)
Supercycle Wave ((5)) in 2007 and Wave ((C)) in 2009 due to 2008 GFC. It just completed the new Supercycle Wave ((1)) in Mar 2018 and now is Wave ((2)), still ongoing. The reason for Wave ((2)) is listed in Wave Count 1 (Black).
Both Wave Count 1 (Black) and Wave Count 3 (Green) appear more valid than Wave Count 2 (Red). However, sightly more basis towards Wave Count 1 (Back) as the length of Wave ((1)) in the case of Wave Count 3 (Green) seem a bit too long (from $0.033 to $1.065).
Focusing on the ongoing correction as shown in the chart below.

The correction pattern looks very straight forward as a double-three combination of zigzag - triangle with the W and X wave being formed. Ongoing is the Y wave, the triangle pattern. At this moment, the question is whether the triangle correction is just trying to form wave c (red) or the last wave e (magenta). This pattern is very similar to the Creative Technology's correction pattern (refer here). Creative Technology took 6 months to complete the double-three (zigzag - triangle) correction and for Valuetronics the correction is into its 7th month. Thus, the correction could be ending soon either this month (the magenta case) or next month (the red case).
After this correction, it will be Supercycle Wave ((5)) (Wave Count 1 -- Black) or Supercycle Wave ((3)) (Wave Count 3 -- Green). Looking at the Fibonacci Retracement, the lowest its fell since the peak in Mar 2018 is less than 50% and its price is now hovering around the 38.2% level. By the time the correction ends, the last wave count, the price level should be between 38.2% to 50% and that amount is more suitable for a wave 4 correction rather than wave 2 correction (typically 61.8%). Thus, this further enforces bias towards Wave Count 1 (Black) than Wave Count 3 (Green).
Added 12th Oct 2018
Refine the correction pattern.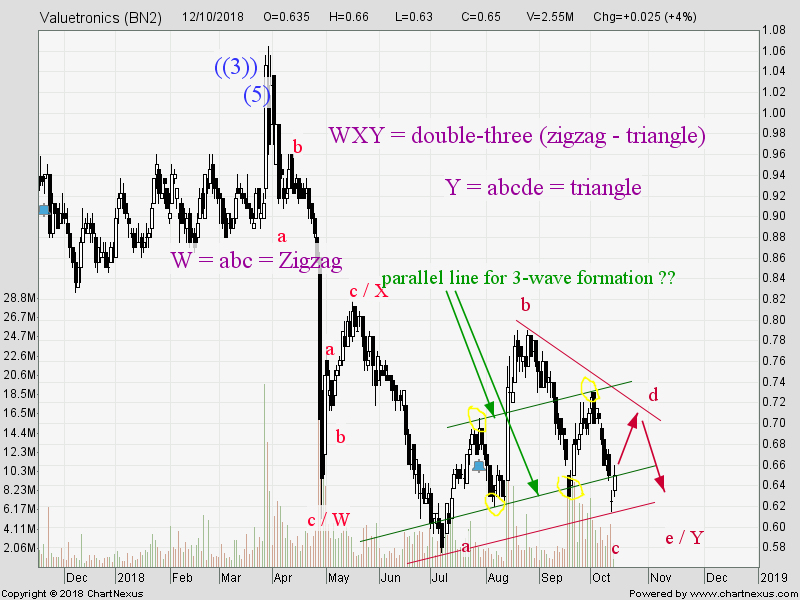
The correction pattern should be a double-three combination, WXY. The W wave is a zigzag and with the X wave formed, current phase is at Y wave. The Y wave appears to be forming a triangle pattern, abcde. By the definition of a 3-3-3-3-3 pattern for triangle, the fall to $0.615 yesterday should be the wave c. Today rebound should be the forming of wave d and thereafter the final wave e. In studying the pattern, an interesting point was found, the pair of parallel line (in green). This set of parallel line appears to define the turning point of the 3-wave of each of the triangle axis. Have not read across such a thing in Elliott Wave description of triangle correction pattern but should that turn out to be true, it should be a useful guide when analyzing triangle correction in future.