Since the correction which started end January 2018 has ended, STI shall be on the motive wave of the wave 3. Motive wave is not as complex and difficult to analyze as Corrective wave thus shall focus less on doing Elliott Wave count. Meanwhile, will be analyzing on the bigger picture of STI in Supercycle degree to get the wave count correct.
STI has a history dating back to 1966 but the data for those early days were very difficult to find. The earliest data which could be found is 1980 meaning from 1966 to 1979 it is impossible to perform any Elliott Wave count. In addition, the duration of 52 years (1966 to 2018) might not fit in 1 complete Supercycle degree so there could be various possibilities in the wave count. To minimize as much possibilities as possible, the following criteria was adopted.
An economy recession is always linked with a Supercycle (or Cycle) degree corrective wave since stock market and economy is linked.

The above chart is STI data from 1980 till 2018. Singapore since post-independence has gone into recession in the following periods.
1. 1985 -- Singapore first recession induced by Government
2. 1998 - 99 -- recession due to Asian Financial crisis
3. 2001 - 2003 -- recession due to dot.com and SARS
4. 2008 -- recession due to US subprime crisis
Wave Count 1 (Black)
The peak in 1984 was Supercycle Wave ((1)), the recession in 1985 was Wave ((2)). The peak in 1996 was Wave ((3)) with Wave ((4)) lasted till 2003 due to the recession in 1998-1999 and 2001-2003. The peak in 2007 was Wave ((5)). However, for this wave count, there was an overlap between Wave ((4)) (due to Wave (A)) and Wave ((1)) which is an Elliott Wave rule violation. This has made this wave count invalid.
Wave Count 2 (Red)
The peak in 1984 was Supercycle Wave ((3)), the recession in 1985 was Wave ((4)). The peak in 1996 was Wave ((5)). Wave ((A))-((B))-((C)) lasted from 1996 to 2003 due to the multiple recessions occurred in 1998-1999 and 2001-2003. The peak in 2007 was Wave ((1)) of a new Supercycle and the trough in 2009 was Wave ((2)) of the new Supercycle. So far there isn't any Elliott Wave rule violation for this wave count.
Wave Count 3 (Green)
The peak in 1984 was Supercycle Wave ((5)), the recession in 1985 was Wave ((A))-((B))-((C)). The peak in 1996 was Wave ((1)) of a new Supercycle. Wave ((2)) for this new Supercycle lasted from 1996 to 2003 due to the multiple recessions in 1998-1999 and 2001-2003. The peak in 2007 was Wave ((3)) and the trough in 2009 was Wave ((4)). Unfortunately, this has Elliott Wave rule violation as Wave ((4)) overlaps Wave ((1)). Thus, this wave count is invalid.
Wave Count 4 (Orange)
The peak in 1984 was Supercycle ((5)), the recession in 1985 was Wave ((A))-((B))-((C)). The peak in 1996 was a new Supercycle Wave ((1)). Wave ((2)) for this new Supercycle lasted from 1996 to 2003 due to multiple recessions in 1998-1999 and 2001-2003. Supercycle Wave ((3)) shall be an extended wave with the peak in 2007 being Cycle Wave (1) and the trough in 2009 Cycle Wave (2) of the extended Wave ((3)). STI now is in Cycle Wave (3) of the extended Wave ((3)). This wave count has no rules violation but some doubts over it. The 2008 GFC was one of the worst after the Great Depression in the 30s and that happened in Cycle degree rather than Supercycle degree is kind of illogical. Furthermore, based on this wave count, the next financial crisis if of another serious one will only happen in Cycle Wave (4) of the extended Wave ((3)). Another recession Cycle degree rather than Supercycle degree.
Both Wave Count 2 (Red) and Wave Count 4 (Orange) are valid wave count but because of the doubts in Wave Count 4 (Orange), it will be biased toward Wave Count 2 (Red). Based on this wave count, STI is now in Supercycle Wave ((3)). When the next recession occurs due to another global financial crisis, STI shall be in Supercycle Wave ((4)). In STI Analysis -- the next peak and trough ? (II), a pattern mapping was carried out to determine when the next peak and trough of STI, it was found to be either peak in 2018 or 2019 and the trough to be in 2020 or 2021. Based on the present wave count, it has to be the case of peak in 2019, recession in 2020 and trough in 2021 implying Supercycle Wave ((4)) shall commence in 2019 and lasting into 2021. The pattern mapping drawing is re-presented as followed.


With the new defined Supercycle degree, the following is the re-labeling of the wave count since 2007.

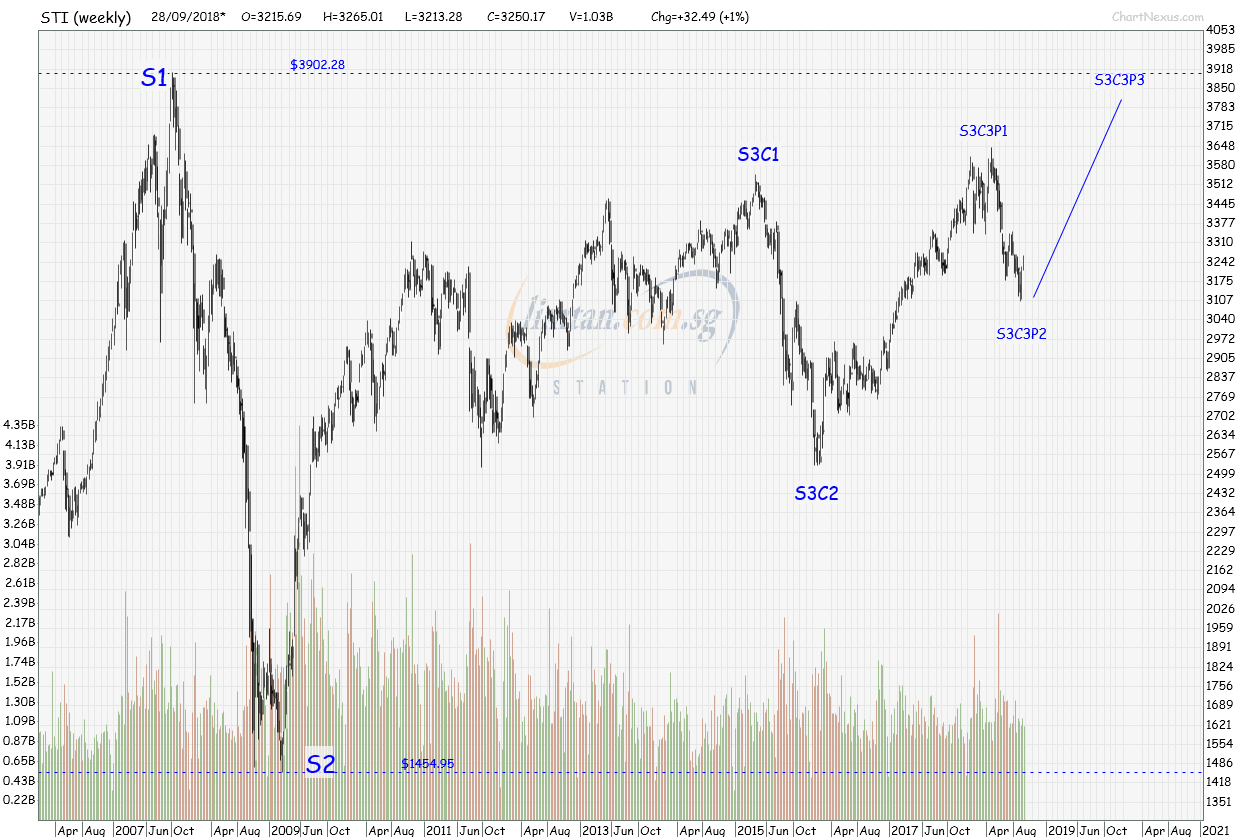
The peak in 2015 was Supercycle Wave ((3)) Cycle Wave (1), S3C1. The trough in 2016 was Supercycle Wave ((3)) Cycle Wave (2), S3C2. The peak in January 2018 was Supercycle Wave ((3)) Cycle Wave (3) Primary Wave 1, S3C3P1 and the correction that just ended was Supercycle Wave ((3)) Cycle Wave (3) Primary Wave 2, S3C3P2. Going forward, the sequence will be S3C3P3, S3C3P4, S3C3P5 (S3C3), S3C4, S3C5P1, S3C5P2, S3C5P3, S3C5P4 and S3C5P5 (S3C5 or S3). If everything go accordingly to what is being projected that shall happen in 2019.
Importance of Correct Wave Count
Probably wondering why so insistence in getting the correct wave count in the Supercycle degree given that 1 full Supercycle will take 40 to 70 years to complete ? There are reasons to that :-
1. By knowing the correct wave count, one can project or estimate the next peak or trough using Fibonacci Ratio as a guideline
2. By knowing the correct wave count, one can time long term investment with very good margin of safety on top of just based on fundamental or valuation. Take the case STI is in Supercycle Wave ((3)) still trying to surpass the Supercycle Wave ((1)) peak. Should one invest in STI ETF now (provided the sponsor will not go bankrupt for the duration of investment), one can expect come the next financial crisis when STI corrects in Supercycle Wave ((4)), the price of STI ETF even at its lowest level then will still be above the present price. This is simply because Elliott Wave rule insists that Wave 4 cannot overlap Wave 1.
Added 2nd Oct 2018
The pull back from yesterday intra-day high of 3268.49 has affirmed STI has completed Minor Wave 1, S3C3P3I1M1 and now in Minor Wave 2, S3C3P3I1M2. From statistical analysis perspective, the completion of Minor Wave 1 can be double confirm and also project the next milestone, peak of Primary Wave 3, S3C3P3.
S3C2 = 2528.44
S3C3P1 = 3611.69
S3C3P2 = 3110.79
The above are past data and using the basic model of w1 : w3 : w5 = 1 : 1.618 : 1, peak of Primary Wave 3, S3C3P3 = 4194.04 (and Primary of Wave 5, S3C3P5 = S3C3 = 4863.49). This calculation is working on the same Elliott Wave degree, Primary degree level.
S3C3P2 = 3110.79
S3C3P3I1M1 = 3268.49
Using the basic model again, peak of Minor Wave 5, also the peak of Intermediate Wave 1, S3C3P3I1 = 3523.65. This will give peak of Intermediate Wave 5, also peak of Primary Wave 3, S3C3P3 = 4191.66. This is the value calculated working from Minor degree up to the Primary degree, bottom up approach. Once Minor Wave 2 value is known, the calculation shall be another step toward accuracy.
The 2 calculated values are almost the same thereby providing another verification that 3268.49 is the peak of Minor Wave 1. The current pull back is Minor Wave 2, probably doing a Fibonacci Retracement of between 50% to 61.8% is perhaps the next best chance to accumulate after missing out during the correction that was started in end January and ended in September.

On the hourly chart, either STI still have that v-iv and v-v leg to go (up and final down) or could be done today already (going by w-x-y count).
Importance of Correct Wave Count
Probably wondering why so insistence in getting the correct wave count in the Supercycle degree given that 1 full Supercycle will take 40 to 70 years to complete ? There are reasons to that :-
1. By knowing the correct wave count, one can project or estimate the next peak or trough using Fibonacci Ratio as a guideline
2. By knowing the correct wave count, one can time long term investment with very good margin of safety on top of just based on fundamental or valuation. Take the case STI is in Supercycle Wave ((3)) still trying to surpass the Supercycle Wave ((1)) peak. Should one invest in STI ETF now (provided the sponsor will not go bankrupt for the duration of investment), one can expect come the next financial crisis when STI corrects in Supercycle Wave ((4)), the price of STI ETF even at its lowest level then will still be above the present price. This is simply because Elliott Wave rule insists that Wave 4 cannot overlap Wave 1.
Added 2nd Oct 2018
The pull back from yesterday intra-day high of 3268.49 has affirmed STI has completed Minor Wave 1, S3C3P3I1M1 and now in Minor Wave 2, S3C3P3I1M2. From statistical analysis perspective, the completion of Minor Wave 1 can be double confirm and also project the next milestone, peak of Primary Wave 3, S3C3P3.
S3C2 = 2528.44
S3C3P1 = 3611.69
S3C3P2 = 3110.79
The above are past data and using the basic model of w1 : w3 : w5 = 1 : 1.618 : 1, peak of Primary Wave 3, S3C3P3 = 4194.04 (and Primary of Wave 5, S3C3P5 = S3C3 = 4863.49). This calculation is working on the same Elliott Wave degree, Primary degree level.
S3C3P2 = 3110.79
S3C3P3I1M1 = 3268.49
Using the basic model again, peak of Minor Wave 5, also the peak of Intermediate Wave 1, S3C3P3I1 = 3523.65. This will give peak of Intermediate Wave 5, also peak of Primary Wave 3, S3C3P3 = 4191.66. This is the value calculated working from Minor degree up to the Primary degree, bottom up approach. Once Minor Wave 2 value is known, the calculation shall be another step toward accuracy.
The 2 calculated values are almost the same thereby providing another verification that 3268.49 is the peak of Minor Wave 1. The current pull back is Minor Wave 2, probably doing a Fibonacci Retracement of between 50% to 61.8% is perhaps the next best chance to accumulate after missing out during the correction that was started in end January and ended in September.
Added 3rd Oct 2018
STI hit intra-day high of 3272.88 before closing at 3267.40. That intra-day high was higher than the intra-day achieved yesterday. However, would remain cautious as that could be part of the Minor Wave 2 correction, the wave B of that. HSI always leading STI by average 1 week in term of Elliott Wave count has entered into the Minor Wave 2 correction and probably in the last stretch of it, and to conclude STI has ended that correction of the same degree seem immature.Added 5th Oct 2018
STI fell to an intra-day of 3198.72 to close at 3209.79. That the Minor wave 2 correction, not just STI but for those stocks that are following STI Elliott Wave count they do enter the Minor wave 2 correction. As this is not an major correction in term of Elliott Wave degree, cut all the efforts to analyze where it will bottom. The will be the best chance to accumulate after post correction.Added 8th Oct 2018
STI hit intra-day low of 3179.82, just 8-9 points above the 61.8% Fibonacci Retracement for Minor wave 2. Can it still fall further ? Possible as a 78.6% Fibonacci level at 3144 is also pretty common for wave 2 correction. As usual too focus on the precise bottom will eventually miss the bigger picture. Knowing roughly where it will be and concentrate on calculated risk shall be a better strategy. One positive thing for today drop is the gap happened between 20th to 21st Sep is now fully covered.