Continued from STI Analysis -- the next peak and trough ? (62)
STI broke 2400 on 19th Mar 2020. 2400 might not mean much to many except being a round number but from my personal analysis perspective, this level is an indicator to determine Singapore economy will or will not go into recession. How much lower it will go will signify how deep the recession will be. This level is computed based on previous peak and trough coupling with at which stage the EW count STI it is in. Hence, after this crisis, the next crisis will have a different level.


STI broke 2400 on 19th Mar 2020. 2400 might not mean much to many except being a round number but from my personal analysis perspective, this level is an indicator to determine Singapore economy will or will not go into recession. How much lower it will go will signify how deep the recession will be. This level is computed based on previous peak and trough coupling with at which stage the EW count STI it is in. Hence, after this crisis, the next crisis will have a different level.

Singapore getting into recession will move one step closer to reflect the above pattern mapping correctness. The past trough (1986, 1998 and 2009) were all happened when there was a recession. So now the 2 important things to monitor for the correctness of the above pattern mapping are trough have to happen in 2020 and there must be a recession.
STI-N
Primary wave 4 didn't happen on 13th Mar 2020 despite a strong intra-day rebound. This suggests the ongoing 5-wave might not be a diagonal meaning the Primary wave 4 will not overlap wave 1 at 2955.68. Thus, this will give STI a normal 5-wave down and there is a very high chance for Primary wave 5 an ending diagonal pattern in the Intermediate degree being developed. Bad thing is the bottom would not be a clean one. Good thing is due to this, there is lesser chance that people would miss the bottom.


Realized there are 2 different versions of the 5-wave calculation by the Fibonacci Calculator being presented so far. One version is the 7th Sep 2019 while the other is 29th Feb 2020. The different is due to different wave 2 value.

The Primary wave 2 displays a triangle pattern with wave ((c)) ending at 3415.18 but the final wave ((e)) is at 3386.65. This is the problem that should the highest value or the final value being taken. As such, this created 2 slightly different versions of the calculated 5-wave value. Should the 1st version being correct, the generated Primary wave 3 value is 2305.281. Should STI finally stages the Primary wave 4 rebound, the intra-day low of 2303.90 on 19th Mar 2020 is just 1.381 point off the calculated value by the Fibonacci Calculator.


The above is what the wave count looks like as of 20th Mar 2020. Note also there are 2 possibilities going forward at this moment. The original one is any rebound from today shall be Primary wave 4 (purple colour). The very visible zigzag shape -- ((a))-((b))-((c)) for Primary wave 3 has led into some question. The length of ((c)) wave for that Primary wave 3 is more than 161.8% that of ((a)) wave making it looks suspicious. Instead as indicates in the red marking, that is actually the Intermediate wave ((i)) and ((ii) and 2303.90 could be the ((iii) and any rebound shall be the ((iv)). Thereafter one more down ((v)) will complete the Primary wave 3. This is because Primary wave 3 is doing an extension (a very common case for wave 3 in general). This should be able to confirm depend on the time frame of the rebound (if it is the one) from 2303.90. A Primary wave 4 should last few months at least while the Intermediate wave ((iv)) only requires minimum of weeks to complete.
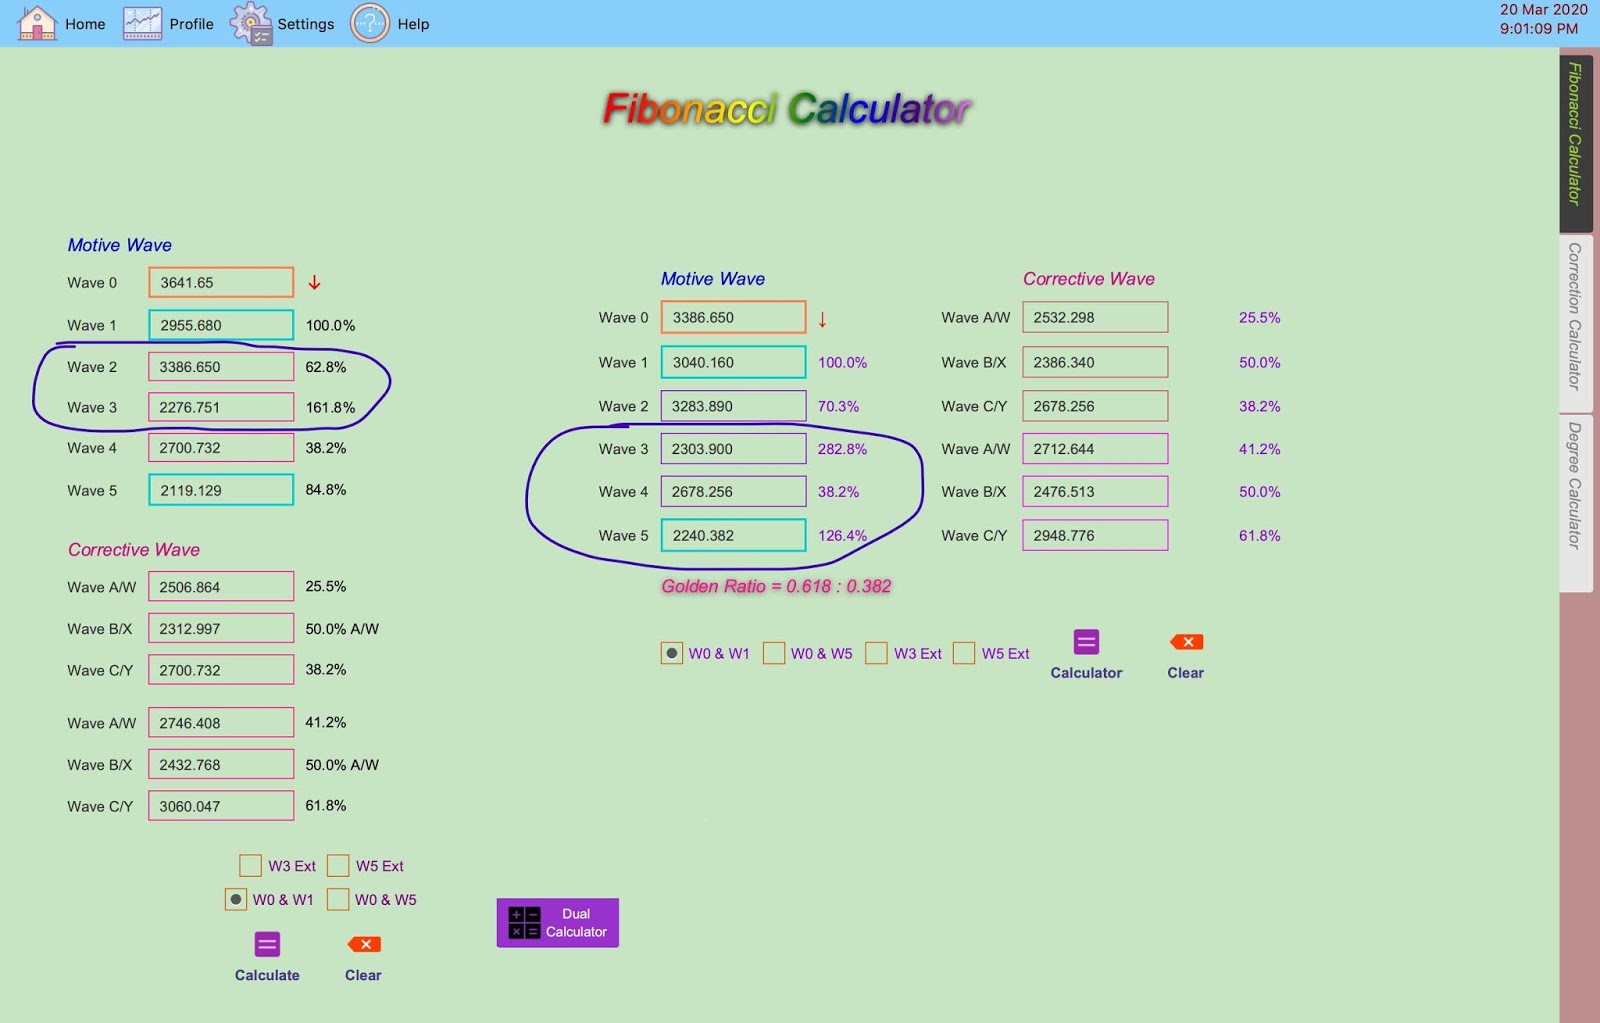
The above is generated from the Fibonacci Calculator focusing on that questionable stretch. The left side is what was being generated on 29th Feb 2020 indicating Primary wave 3 ends around 2276.751. The right side is considering there is an extension in Primary wave 3. For the extension, taking Intermediate wave ((iii)) to end at 2303.90, this shall lead Intermediate wave ((v)), Primary wave 3, to 2240.382, which is quite close to 2276.751. This gives some concrete evidence to suggest what STI is doing now is actually the Intermediate degree of the Primary wave 3. The duration of the rebound (if it is the one) from 2303.90 will determine which is which.
Knowing the nature of this rebound (if it is the one), Primary or Intermediate degree, can give one a better idea of when and how to enter the market !
Added 21st Mar 2020

Forget to mention the above on 20th Mar 2020. This was the generated value of SuperCycle ((2)) on 7th Sep 2019. Cycle wave ((C)) is 100% of wave ((A)) at 2528.44 is no longer valid. The next lower Fibonacci ratio is wave ((C)) = 123.6% wave ((A)) looks impossible either as based on above analysis, that value of 2265.722 could be the end point of Primary wave 3 of Cycle ((C)). That leaves 138.2% (2103.194), 150% (1971.835) and 161.8% (1840.475) as highly possible ending value for Cycle wave ((C)) or SuperCycle wave ((2)). The sharp and fearful fall in 2008 GFC, the one that crash until bottom at 1455.47 on Mar 2009 have a wave C value of somewhere around 150% of wave A.
Should the 161.8% value of 1840.475 cannot hold, the above wave count will be incorrect and this will bring to the wave count that since the peak in 2007, STI never get out of correction and is doing a SuperCycle correction of ((A))-((B))-((C)) with bottom of 2009 being ((A)), peak in 2018 being ((B)) and now ((C)). The ((C)) could be equaled or even lower than 2009 low of 1455.47. So better be prepared for such a scenario as when it actually does happen, it is something expected and should not be fear and panic about. There is much serious implication should this scenario happens relating to Singapore economy. Detail will reveal more should such a scenario actually happens.